Does Class Year Impact One’s Opinion and Consumption of FOCO Cookies?
(Co-written with three other group members--names redacted in case they don't want this published)
Our group attempted to answer the research question: how do factors such as one’s class year, gender, athletic status, and greek affiliation affect a student’s opinion and consumption of cookies from Dartmouth's main dining hall, FOCO? We hypothesized that class year would have the strongest correlation with both one’s opinion and consumption of FOCO cookies since the cookies are newest and most exciting to the 22s. Our motivations for this group project were simple: since we are all 22s who love FOCO cookies, we were curious to discover whether the rest of the school felt the same way.
Our methodology included handing out a survey (shown below) to a random sample of Dartmouth students.
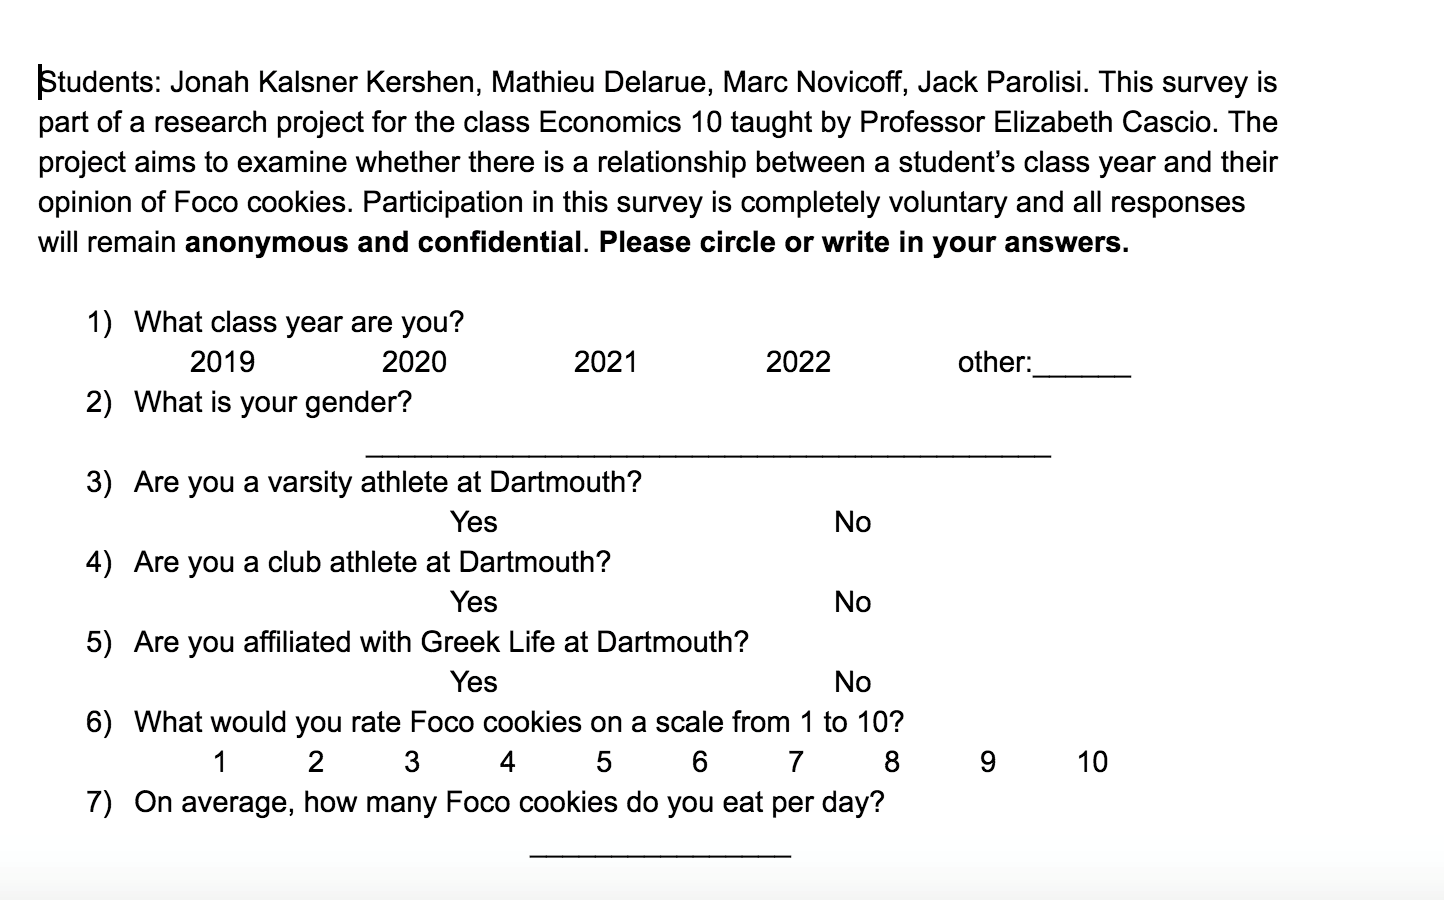
Our population of interest was Dartmouth’s undergraduate student body. We generated a Simple Random Sample (SRS) by distributing our survey at the front entrance to Baker Library, and by the stairs outside of Novack. The total number of observations we collected was 179. Going off of our hypothesis, the first independent variables we introduced to a multivariate regression were dummy variables for class year (class19; class20; and class21). To control for omitted variables that may also affect the results of our study, we introduced addition independent dummy variables for gender, varsity athlete status, club athlete status, and greek affiliation status. These variables were male, varath, clubath, and aff, respectively, where 1 denotes having that characteristic and 0 denotes not. The dependent variables we used were rate, a discrete variable for what the person would rate the cookies out of 10, and eat, a continuous variable for the average number of cookies consumed by the respondent per day. Here are the two multivariate regressions that we tested:
- ratei = β0 + β1class19 + β2class20 + β3class21 + β4male + β5aff +β6varath + β7clubath
- eati = β0 + β1class19 + β2class20 + β3class21 + β4male + β5aff +β6varath + β7clubath
To determine which variables exhibit statistical significance in these regressions, we conducted both F tests and T tests. In the F tests, we tested whether the coefficient on all of the class year dummies were zero. Thus, the null hypothesis was that they were all equal to 0, and the alternate hypothesis was that 1 or more of them was not. We did this F test for both eat and rate. For the F test, our unrestricted model included 7 independent variables (male, varath, clubath, aff, class19, class20, and class21), and our restricted model included 4 independent variables (male, varath, clubath, and aff).
If the F test resulted in F > F* (F* represents a critical value) at the conventional levels of significance (𝛂 = 0.1, 0.05, 0.01), we could determine that at least one of the coefficients in question did not equal zero, and that consumption of cookies or rating of cookies actually differed by a statistically significant amount based on one’s class year.
Our T tests were conducted using this same unrestricted model by analyzing the t-statistics and p values in STATA’s regress output. Here, the null hypothesis is that the specific coefficient on a single specific independent variable (aff, for example) is 0, and the alternate that it’s not. We did T tests on all 4 non-classyr independent variables for both dependent variables.
If a T test resulted in p < 𝛂 at the conventional levels of significance (𝛂 = 0.1, 0.05, 0.01), we could determine with varying degrees of certainty that the variable added something concrete to our model, actually making it more robust, considering that the coefficient is now almost definitely not zero. This tells us that the variable actually affects an individual’s cookie consumption or rating of the cookies.
Our null and alternative hypotheses are the following for the T tests, no matter the dependent variable:
H0: The coefficient on [insert a non-classyr independent variable (either aff, male, clubath, or varath)] in the multivariate regression is zero (for example, β6 = 0).
Ha: The coefficient on the variable in the multivariate regression is not zero
The table below is STATA’s regress output for the regression that includes all 7 variables, using rate as the dependent variable:
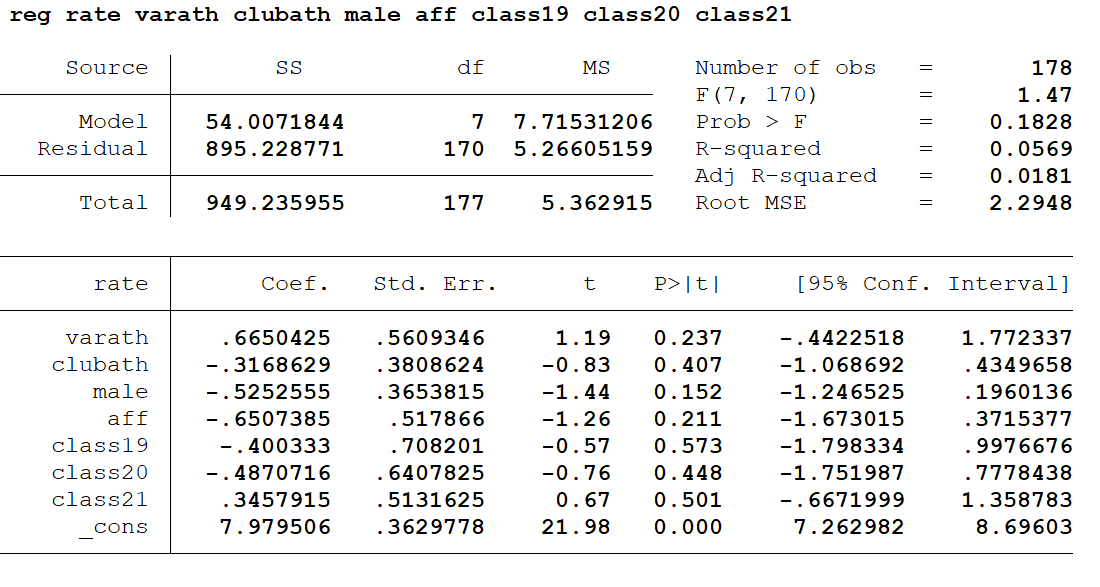
The p-values on these t-values, which represent the probability of finding a t that far away from zero or further, and therefore the probability that the coefficient in front of the variable is equal to 0, never was less than .1, the most generous of the conventional levels of significance. Therefore, we fail to reject each null hypothesis that each coefficient is zero.
The table below is STATA’s regress output for the regression that includes all 7 variables, this time using eat as the dependent variable:
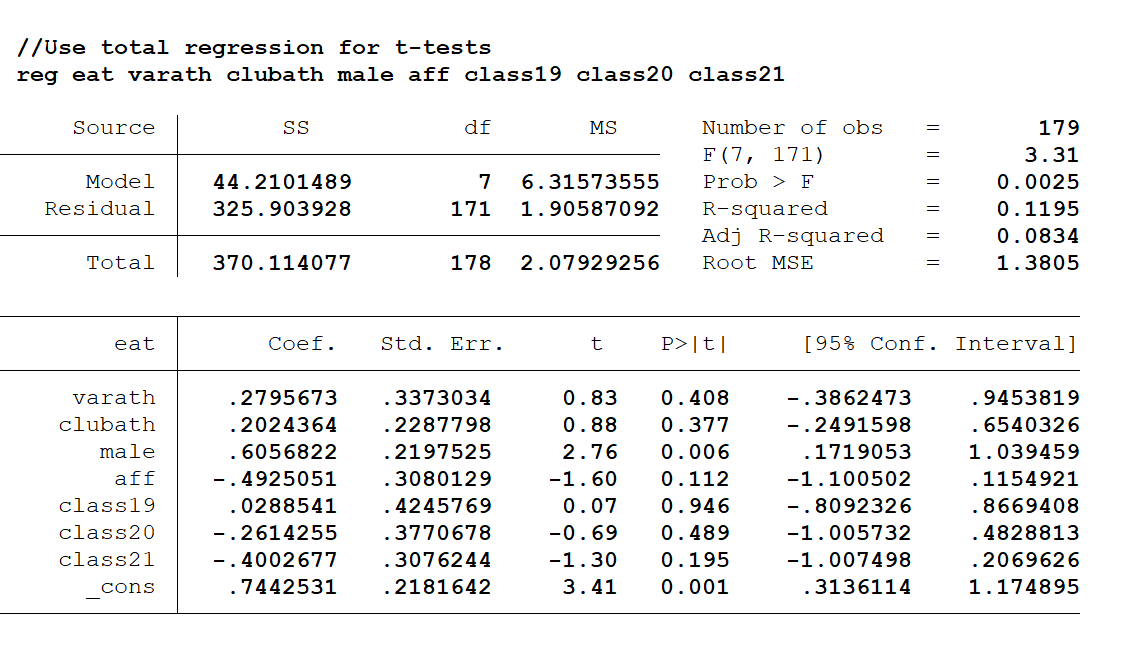
The only non-classyr independent variable with a p lower than .1 is male, with a p-value of .006, allowing us to reject the null hypothesis of male’s coefficient being zero at all conventional levels of significance (𝛂 = .1, .05, .01). Therefore, we can statistically conclude that one’s gender affects the number of FOCO cookies they eat per day. For the rest of the variables, we cannot conclude with conventional levels of certainty that their coefficients aren’t zero. Therefore, we also cannot conclude that these variables affect FOCO Cookie rating with any conventional level of certainty.
Our null and alternative hypotheses are the following for our F-test, regardless of the dependent variable:
H0: The coefficients in front of all of our classyr dummies are zero ( β1 = β2 = β3=0)
Ha: At least one of these coefficients is not zero.
Using eat as the dependent variable, the unrestricted R2 = .1195 for the regression with all the independent variables and the restricted R2 = .1060, taking out the class year dummies.
Thus F = .8739, and F* = 2.14, 2.70, 3.98 for the conventional levels of significance (𝛂 = .1, .05, .01, respectively).
Since F<F* for all conventional levels of 𝛂, we fail to reject the null hypothesis, concluding that how many FOCO cookies you eat daily is not statistically significantly affected by class year.
Now moving onto rate as the dependent variable, the unrestricted R2 = .0569 (with all three classyr dummies added in), while the restricted R2 = .0427 (all the classyr dummies left out). Using the same F formula as before,
Thus F = .9193, and F* = 2.14, 2.70, 3.98 for the conventional levels of significance (𝛂 = .1, .05, .01, respectively).
Since F<F* for all conventional levels of 𝛂, we fail to reject the null hypothesis of all of the coefficients in front of the classyr dummies in the regression being zero, concluding FOCO cookie rating is not statistically significantly affected by class year.
Comparison of Means Table
| Variable | Mean Rating | Mean Cookies per Day |
| 22’s | 7.60 | 1.21 |
| 21’s | 7.62 | .539 |
| 20’s | 6.85 | .407 |
| 19’s | 7.00 | .589 |
| non-22’s | 7.25 | .514 |
| Affiliated People (non-22s) | 6.98 | .382 |
| Un-Affiliated People (non-22s) | 7.78 | .768 |
| Males | 7.23 | 1.18 |
| Females | 7.59 | .511 |
| Club Athletes | 7.20 | 1.04 |
| Non-Club Athletes (who aren’t varsity athletes) | 7.43 | .652 |
| Varsity Athletes | 8.05 | .998 |
| Non-Varsity Athletes | 7.33 | .815 |
To determine whether class year exhibits economic significance in this study, we analyzed the mean number of FOCO cookies consumed per day and mean rating of the cookies between 22s and non-22s at Dartmouth. If the difference in means between those who are 22s and the non-22s was large in magnitude for the dependent variables eat and rate, then we can conclude that they are significantly different economically.
Using this method, we found that the relationship between classyr and rate is not economically significant, as the means differ by only 0.349 points out of 10, or a 3.49% difference. The fact that the relationship between classyr and rate is neither statistically nor economically significant surprised us and proved our initial hypothesis false. However, we determined the relationship between classyr and eat to be economically significant, as 22s on average eat 0.695 more cookies per day than non-22s. To put this into context, this means 22s eat about 5 more FOCO cookies per week than the other classes. This is an interesting conclusion due to the relationship between class year and the number of FOCO cookies one eats not being statistically significant. This shows the importance of examining both the statistical and economic significance, as one could claim significance in one test while failing to claim significance in the other. Another conclusion from this is that, while non-22s love FOCO cookies all the same, they don’t consume them at as high a rate, possibly due to different dining plans.
There are multiple caveats that may have affected this study. First, some of our f-statistics and t-statistics barely missed the 90% level of conventional significance cutoff. Unfortunately, we couldn’t determine that certain variables exhibited any statistical significance despite their close proximity to the 90% certainty standard. Additionally, we received small sample sizes for some of our test categories (only 21 varsity athletes filled out our survey), and thus the ratings for FOCO cookies are not inherently normally distributed. It is also likely that some groups don’t go to the library as much as others, such as students living further from the library or athletes in season.
The only T test to actually show statistical significance in this study was the effect of the male variable on the dependent variable eat, which had a p-value of 0.006, showing statistical significance at all conventional levels of 𝛂. This allowed us to conclude with 99% certainty that the coefficient on the male variable is not equal to zero in the regression for the eat variable.
Through analyzing the economic and statistical significance of the relationship between the independent variable classyr and dependent variables rate and eat, we were able to determine that our initial hypothesis going into this study was primarily incorrect. We predicted that 22s would rate FOCO cookies higher, on average, than non-22s would due to the fact that we have been exposed to the cookies for a shorter period of time, but this turned out to be incorrect by measures of both economic and statistical significance. Though the relationship between classyr and eat failed to demonstrate statistical significance, it did exhibit economic significance, as our data shows that 22s on average eat nearly 50 more FOCO cookies per term than the other classes. This conclusion goes to show that it is always important to analyze both statistical and economic significance, as simply analyzing the statistical significance of our data would have left us ignorant to the fact that 22s are consuming roughly 2.35 times more FOCO cookies on average than other classes.