I am writing this as of 3:00 PM EST on January 13th, 2022. I typically wouldn’t start blogging about a specific storm unless it’s within a few days of the event. I think the eastern half of the United States is in for quite the snow maker! We’ll get to the snow for the Upper Valley in a moment, but let’s check out some of the snowfall projections for the south. Let’s compare the models.
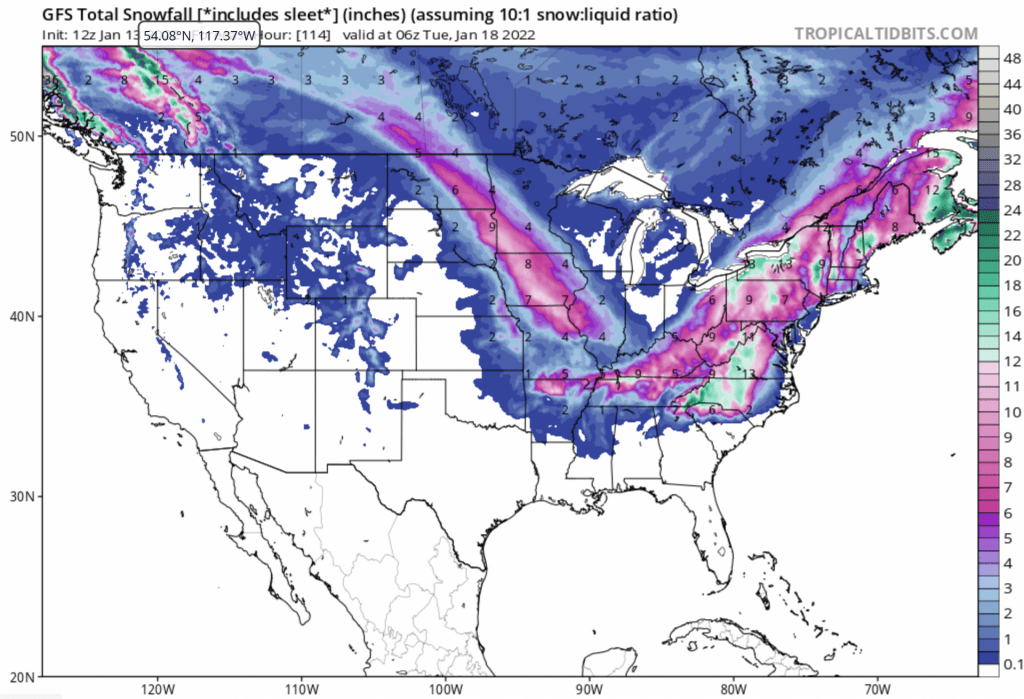
Here’s the GFS: (The American Model)
You can see exactly how the upper level trough will form over the U.S. Check that out!
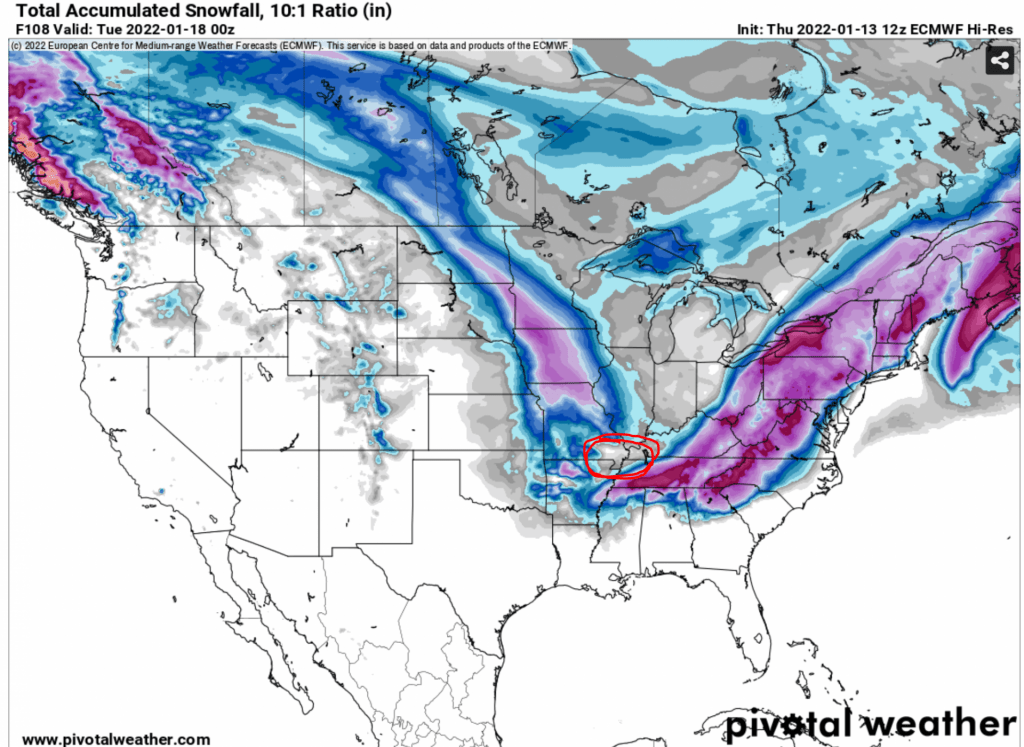
Here’s the ECMWF snowfall projection (The European Model):
Notice the difference in the area circled in red. That’s where I’m from! Typical Region 8. We’ll see how that pans out!
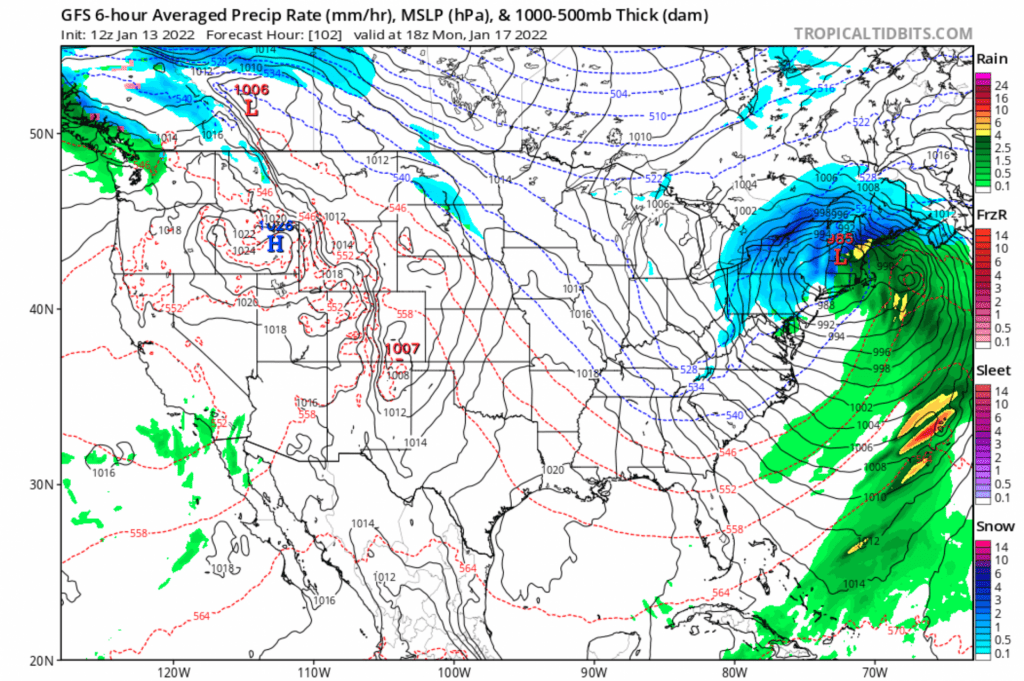
Now let’s check out what the storm placement should look like for the Upper Valley! Here’s the GFS:
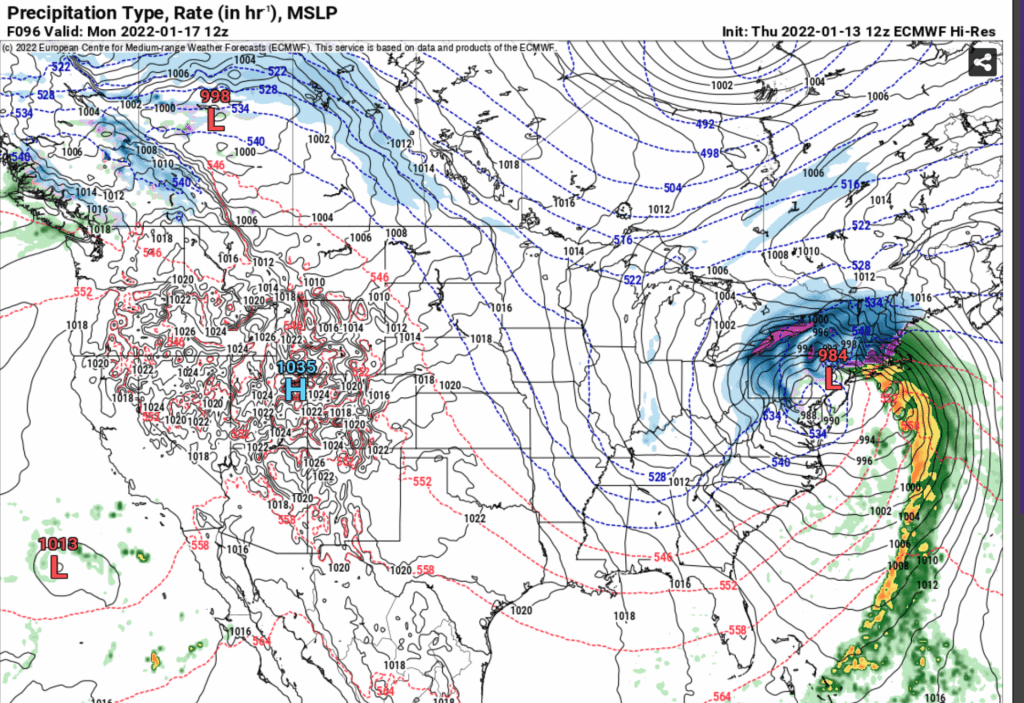
Here’s the EURO for comparison:
Either way, I think this will be a whopper of storm system for New England and parts of the Mid-Atlantic.
I will also be using this blog to hold myself accountable…. I am going to predict (as of 1/13) the snow measurement as of 1/17/22 at 5PM EST will be 7.2″ We’ll just have to see!
I will frequently post when new information becomes available, but this thing WILL happen! Now it’s a matter of exactly when and where. I’ll keep updating! be sure to plan accordingly.
Around the 1/05 and 1/06 timeframe, a (relatively weak) nor’easter made its way up the east coast of the U.S. unleashing some killer snow totals for the Mid-Atlantic region. Check out those totals!
In fact, this same storm system brought a little bit of snow to the Upper Valley as well! The official measurement sent to the NWS was 1.8″ measured at the Shattuck observatory in Hanover New, Hampshire. Not the biggest snowmaker for these parts, but it was a pretty snow! Just see for yourself!
To start the new year off with a bang, a powerful mid-latitude cyclone has developed across the bread-basket of the nation. This storm system is currently brining a round of severe weather to the deep south into parts of MS, AL, TN, and AR. In central MO and eastern KS, the forecast is difficult to pinpoint what kind of precipitation will fall and for how long. The NWS is anticipating an ice threat from Kansas city to SE Iowa. Above that into parts of northern MO, northeastern KS, parts of Iowa, Illinois, Nebraska, Michigan, and Indiana will see a moderately significant winter storm.
The SPC has issued a moderate risk extending from the Ark-La-Tex area creeping into middle TN and the deep south. The chance for severe storms including hail, a few tornadoes, and a wind threat is probable to the south of the wintry precipitation.
Here’s the latest model run of the NAM (3km resolution) for a layout of the storm as of 10:30 A.M EST.
Thank you for checking out some of my research! This climatology report of tornadic activity in the Mid-South is my very first experience with research. I hope you enjoy reading through it
Oh. My. Word. I am writing this at 11A.M CST on December 10th 2021. Currently, the Storm Prediction Center in Norman, Oklahoma has much of the Mid-South (southeast MO, northeast AR, western KY, and southern IL) under a moderate risk for severe weather including strong tornadoes, damaging winds, and hail overnight.
As of the 1630z (10:30 CST) update, the SPC has issued a large portion of the central and southern United States to be at a risk of severe weather. Ample moisture from the Gulf of Mexico will fuel instability throughout the day on Dec. 10th, giving way to a surge of severe weather overnight as the cold front makes it way through the Mid-South area.
See convective outlook map below:
From my time in the Missouri Bootheel (where I currently am staying over winterim), I don’t think I’ve ever quite seen this amount of instability in the atmosphere this late into the year. Nevertheless, Mid-South weather never fails to surprise me. This is going to be a particularly dangerous event given that most of the possible tornadoes are going to be nocturnal. As the lower atmosphere near the surface heats during the day due to solar heating, the cold front will interact with this warm, moist air later in the day that will give way to our severe storms. This is quite incredible.
Some of the higher-resolution forecasts models like the North-American Mesoscale forecast system (NAM) are projecting CAPE (Convective Available Potential Energy) well above the 1500 J/kg range that would be indicative of severe weather. In some locations that lie within the moderate risk, the NAM is putting out CAPE values above 2,000 J/kg. See below:
I will end this part of the post at 11:25AM CST and will continue with the blog when new information becomes available. I anticipate the primary severe weather threat in the Mid-South region to last anywhere from 9 PM to 3AM.
1:35 PM CST UPDATE:
As of 1:35 PM CST, the Storm Prediction Center has issued a mesoscale discussion outlining portions of southeast Missouri and northeast Arkansas to start seeing favorable conditions for tornado development well ahead of schedule. Diurnal heating throughout the late morning and the early afternoon will give way to convective severe thunderstorms in the late evening. This setup is looking to be a nasty one. More updates to come. See below:
UPDATE: 3:27P.M CST
The Storm Prediction center has issued Tornado watches for the counties shaded in red in the image below, ranging from eastern Missouri and Arkansas, southern Illinois and Indiana, western Tennessee and Kentucky and far northwestern Mississippi. Additionally, I can tell that the diurnal heating is fueling this instable atmosphere. There are frequent breaks in the clouds which is allowing for higher temperatures ahead of the convective event. This will get ugly very quickly. In fact, the tornado watch summary has elevated the risk to a 5/5 high risk according to the Storm Prediction Center. See below:
I am typing up this update after the night of total destruction across the mid-section of the United States. There was an incredible path of damage that originated in Northeast, Arkansas near the city of Weiner, through the southern part of the Missouri bootheel (about 3 miles from my house) into areas of northwestern Tennessee and absolutely devastating parts of Kentucky. This was an incredible storm that, I think, will be historical. Although the reports are preliminary and verification needs to take place, I think this may be one of the longest tracked tornadoes in the Mid-South’s history. Below is a picture of the damage reports as indicated by the Storm Prediction Center as of the morning of December 11th, 2021.
It is my educated guess that the line of red triangles you see (tornado reports) that stretches in a straight line from NE Arkansas to KY is one tornado. If so, this would be one of the longest tornado tracks in this region’s history, rivaling the Tri-state tornado in length.
Below are some pictures of the damage a few miles from my house near Hornersville, Missouri. It speaks for itself.
This was an INCREDIBLY powerful tornado. As I said, it still requires verification as of 12/11, but I am still in awe that I was able to report on it.
Again, this thing lasted from Weiner, Arkansas into western Kentucky. I pray for all of the families affected. This is Correlation-Coefficient radar imagery following the path of this tornado. Keep your eyes on the triangle in the image. That’s where the tornado / rotation is. You can clearly make out the damage path and when debris gets lofted into the air. Absolutely amazing.
Here is a link to the Kentucky Governor’s address to the public after this horrific tornado tore through many parts of the western part of the state.
UPDATE:
I don’t want to prematurely state this, but I think this may be the longest-track tornado in HISTORY. See below:
Legendary meteorologist James Spann in Alabama gives his comments on this “Quad-State Tornado” reinforcing the point that it will take a considerable amount of time and effort by the NWS to determine the rating and path of this monster. Stay informed with the credible sources like the NWS and Mr. Spann!
Here is a video of the satellite imagery of the severe weather. Notice the convective activity correlated to the damage path in James Spann’s post. It is the same tornado.
Also, here is another video that truly showcases the carnage in Mayfield Kentucky, from the same tornado, mind you that touched down in northeast Arkansas and the Missouri Bootheel.
I think I will end my analysis on this historic tornado and tornado outbreak event here. But don’t worry, if you want more information on this specific storm, there won’t be a shortage of news coverage on it for the end of time. It truly was historic and I’m so glad I was able to report on it and document it on this page. My thoughts are with the families of the most affected, particularly in Kentucky. This is why I want to dedicate my life to the study of weather and climate. I want to figure out if outbreaks like these are becoming more common and put that science into practice!