

The living arrangements of the elderly are largely dependent on their help seeking behaviors and the resources available to them (Coward 1989, 814). Factors such as increased life expectancy, higher fertility rates, cultural shifts, economic changes and industrialization have all been argued to have altered the living arrangements of elderly americans. I will argue that the higher life expectancy of women than men has led to a rise in single elderly female households. Furthermore I will argue that the increasing economic resources available to the elderly have made living away from family a more feasible alternative.
Data:
The data used for this analysis are from the census data available on the Integrated Public-Use Microdata Series (IPUMS). My data set is composed of one percent samples from the 1920 to 1970 United States censuses. In 1970 I use the 1% state form 1 sample. PUMS has randomly selected the one percent samples used for my analysis. I use the The IPUMS organized variables FAMSIZE and GQ for my analysis. The FAMSIZE variable counts the number of one’s own family members that an individual is living with. This variable is imputed by IPUMS based on several other variables that classify relationships within a household. Family members are anyone related by blood, marriage or adoption. The GQ variable classifies the type of housing unit that an individual is living in (specifically it classifies units as households or group quarters). For all censuses prior to 1940 a “household” was classified as any unit with nine or fewer persons unrelated to the head. From 1940 to 1970, the definition of a household was restricted to four or fewer persons unrelated to the head. All analyses are weighted by PERWT, the sample weight of each individual.
Methods:
I begin my analyses by restricting the data set to the elderly (individuals over 65 years and older). Then I classify the living arrangements of elderly individuals as living alone, with family members or in group quarters. Individuals living alone are identified as living in a household (GQ==1) and not living with any other family members (FAMSIZE==1). Individuals living with family are identified as living in a household (GQ==1) and living with one or more family members (FAMSIZE>1). Individuals living in group quarters are identified as anyone living with over 4 unrelated persons (GQ>=2). I use this definition of group quarters so that data from before 1940 are comparable to data after 1940. However due to the census’ change in the definition of a household, this may be too wide of a definition for what qualifies as group quarters. Prior to 1940 large households with many servants or boarders was common. Therefore in my analysis, there may be too many individuals in 1920 and 1930 identified as living in group quarters.
After identifying three types of living arrangements, I analyze the living situation of elderly men compared to elderly women. First I graph the population of elderly men and women over time with regard to where they live. Then I graph the proportion of the total elderly men living in each identified living arrangement. I do the same for elderly women. Code for my analysis and visualizations is available here.
Results:
Figure 1:
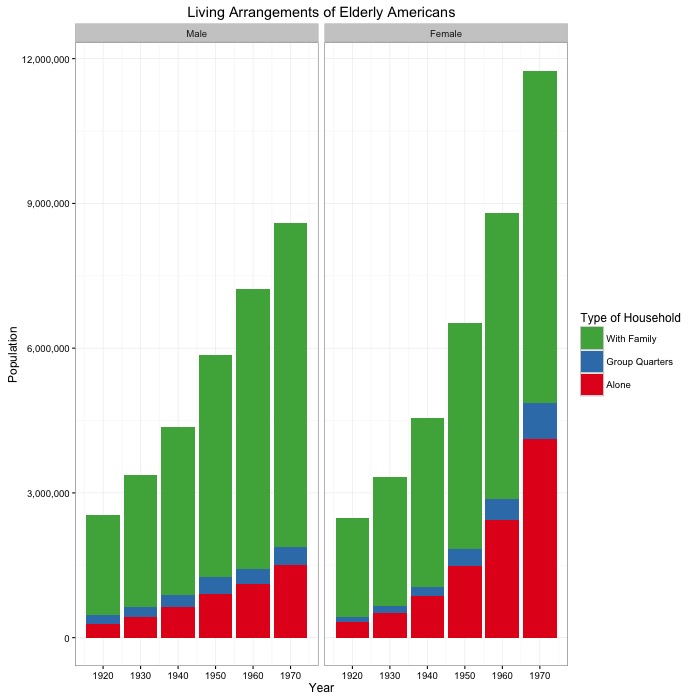
Figure 1 graphs the population of elderly men and women from 1920 to 1970 with respect to their living arrangement. The population of both men and women grows steadily over the time period. The population elderly men and women is similar from 1920 to 1940. From 1950 to 1970 there are always more elderly women than elderly men.
Figure 2:
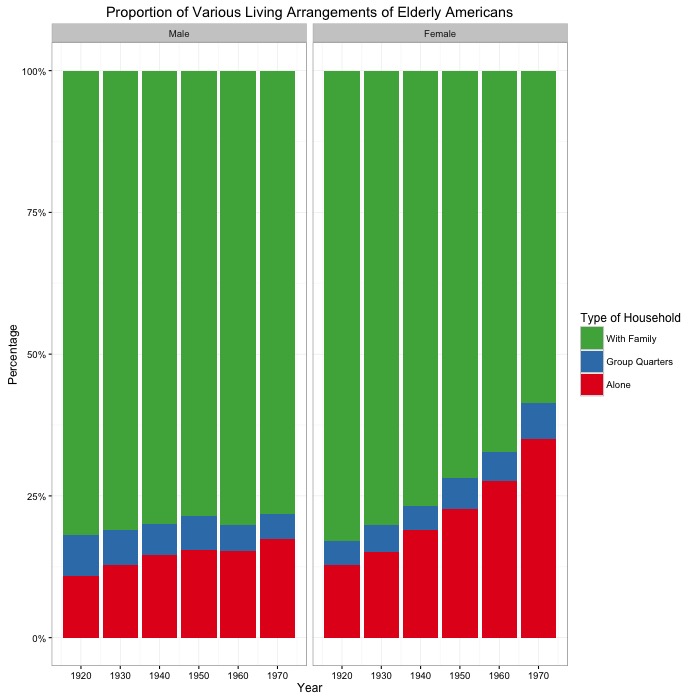
Figure 2 graphs the proportion of the total elderly population for each sex living alone, in group quarters or with family. For all years and both sexes, the majority of elderly individuals live with family. The proportion of men who live with family decreases very slightly and unsteadily over time. The proportion of women who live with family decreases steadily over time. Living alone is the next largest living arrangement for both men and women. For men, the proportion of individuals living alone increases very slightly over time. For women, the proportion of individuals living alone increases steadily over time. The smallest proportion of elderly men and women live in group quarters. For men, the proportion of individuals living in group quarters decreases slightly over time. For women, the proportion of individuals living in group quarters stays fairly constant over time.
In my analysis the living arrangement of men does not change significantly because my method of categorization does not distinguish between coresidence with children (or other extended family) and living alone with a spouse. Therefore because women typically outlive their male spouses, the trends of autonomous living arrangements is more significantly seen in the visualization of female living arrangements. The increasing trend in women living alone is likely a reflection of the empty-nester phenomenon (married couples living alone) argued by Brian Gratton and Myron Gutmann. The scholars explain that prior to 1940, rising life expectancy and decreasing fertility rates contribute to elderly parents living away from their children. However after 1940 these factors no longer sufficiently explain changes in living arrangements. Instead, after 1940, the significant gains in economic status for both generations (the elderly and their children) are a more accurate explanation for autonomous living arrangements. Increasing affluence and the decline of the agricultural economy meant multigenerational living arrangements were no longer necessary. Moreover by 1950 old age assistance benefits had rapidly expanded. The expectation of a steady income from social security benefits is another strong causal argument for the increase in elderly individuals living away from family (Gratton 2010, 332-343). Steven Ruggles supports this explanation of the decreasing multigenerational family. Ruggles explains that from 1850 to 1920 high economic status was closely associated with multigenerational families. However from 1940 to 1970 this phenomenon diminished and multigenerational households became more common in households with a low economic status (Ruggles 2003, 159-160).
Conclusion:
Over the course of the twentieth century as healthcare improved and life expectancy increased, elderly americans simultaneously attained greater economic autonomy, therefore making living away from other family members possible. This trend in the living arrangement of the elderly is most obviously evidenced in my analysis of elderly women. Because women had a longer life expectancy than men and elderly men typically lived alone with their spouses in old age, the trends of autonomous living arrangements are more obvious in the visualization of elderly women.
Bibliography:
Coward, R. T., S. J. Cutler, and F. E. Schmidt. “Differences in the Household Composition of Elders by Age, Gender, and Area of Residence.” The Gerontologist 29.6 (1989): 814-21. Web.
Gratton, Brian, and Myron P. Gutmann. “Emptying the Nest: Older Men in the United States, 1880–2000.” Population and Development Review 36.2 (2010): 331-56. Web.
Ruggles, Steven. “Multigenerational Families in Nineteenth-Century America.” Continuity and Change 18.1 (2003): 139-65. Web.