

Millions of southern-born Americans immigrated out of the South to Western and Northern regions of the country between the decades of 1910 to 1970. Tolnal et al. has exemplified the racial discrepancies in demographic migration trends between southerners when considering distances traveled from their birthplace during this period. However, demographic migration trends have continued to develop with racial difference after 1970. I was born in Houston, Texas in January of 1994. Although this was well after the accepted end of the great migration, much of my extended family decided to move to the Northeast after my birth. In this study, I am examining demographic differences in the migration trends of Texas-born people, looking specifically at racial differences between settlers in the Northeast and West.
Data:
The data for this analysis are collected from the University of Minnesota’s Integrated Public-Use Microdata Series (IPUMS). I used 1% samples from years 1930 to 2000; for 1970 I used the 1% State Form 1 sample, and for 1980 I used the 1% Metro sample. In contrast to Tolnay et al., who focused on migration trends of men, I included both men and women of all ages in my study. The IPUMS variables I used are AGE, SEX, YEAR, RACE, BPL, REGION, and PERWT. Variables AGE and SEX indicate self-reported age and sex; YEAR indicates the given census year; RACE indicates the race of the individual; BPL indicates the birthplace of the individual by state; REGION indicates the current region that the individual lives in, as delineated by the census; PERWT indicates the sample weight of each individual in the sample. PERWT was used to weight all of the following analyses.
Method:
I contained my analysis of Southern emigration 1) to men and women from Texas and 2) to those that moved to the Northeastern and Western regions of the country, as defined by the Census Bureau. The Northeast region includes Connecticut, Maine, Massachusetts, New Hampshire, Rhode Island, Vermont, New York, New Jersey, and Pennsylvania. The West region includes Arizona, Colorado, Idaho, Montana, Nevada, New Mexico, Utah, Wyoming, Alaska, California, Hawaii, Oregon, Washington. I first created age categories to assign to each individual, each spanning 10 years (1-10 years old, 11-20 years old, ect.). I then delineated each individual into race categories for either White or Non-White, in order to look at differences between the two groups. Then, I separated the two groups by those living in the Northeast and those living in the West. I first graphed the decennial numbers of both Whites and Non-Whites living in both the West and Northeast, looking at the ratio between the two race categories. I then made a series of population pyramids for both race categories in both of the regions for the years 1940, 1970, and 2000. According to Tolnay, 1940 and 1970 would encompass what many believe were the first and second waves of the great migration, respectively. The 2000 census would include the decade during which much of my family moved from Texas to the Northeast. My R code can be found here.
Results:
Figure 1:
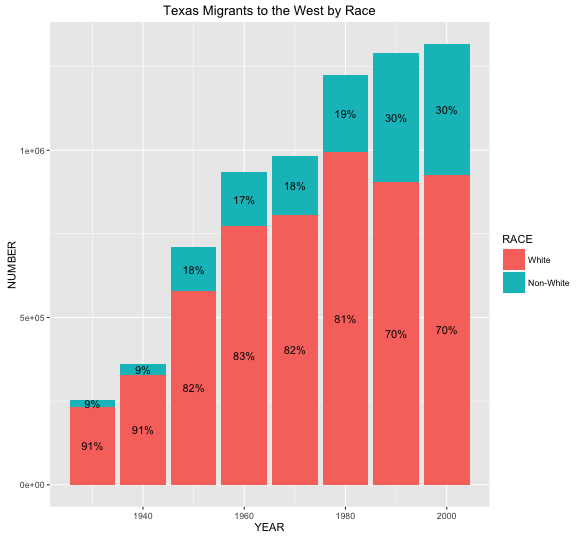
Figure 1 shows the decennial numbers of both White and Non-White, Texas-born people living in the West. Here we see a gradual increase in the proportion of Non-White, Texas-born people living in the West throughout the decades examined. It is interesting to note the significant increases between both 1940 and 1950 as well as between 1980 and 1990. The later is a demographic change that would not have been captured in the research that studied the Great Migration. There is both a notable increase in the number of Non-White, Texas-born people in the West, as well as a significant decrease in the number of White, Texas-born people in the West. The later decrease could be both due to factors such as natural mortality and a trend of returning to Texas for White, Texas-born people between the years of 1980 and 1990.
Figure 2:
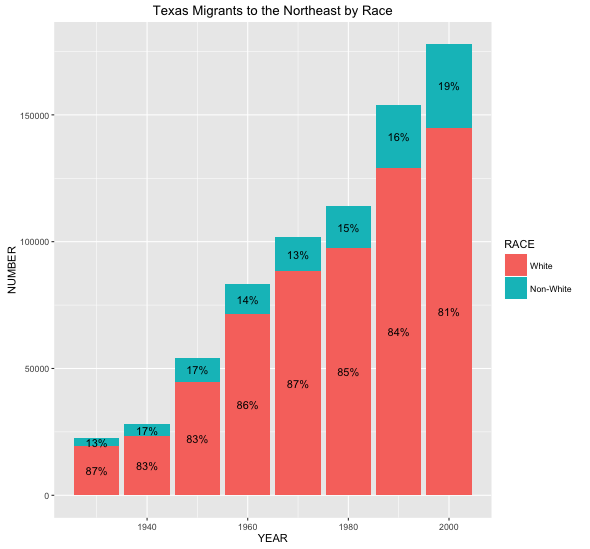
Figure 2 shows the decennial numbers of Texas-born migrants living in the Northeast over the decades examined. This plot shows a more consistent increase in the rates of both White and Non-White, Texas-born individuals living in the Northeast than Figure 1. Furthermore, the ratios of White to Non-White persons remains significantly more consistent during the decades examined than in Figure 1. However, it is important to note how few Texas-born individuals there have been living in the Northeast in comparison to the West. Although I have neglected to examine the differences in distances traveled, as done by Tolnay et al., this is a trend that was not found in their data. This would support the assumption that most people who left the south during the Great Migration to live in the Northeast came from the more Eastern zone of the southern region.
It is also interesting to note the difference between Figures 1 and 2 when considering the previously mentioned demographic trend defined between 1980 and 1990 in Figure 1. Texas-born individuals living in the Northeast did not exhibit the same trend.
Figure 3:

Figure 3 displays a population pyramid showing the age structure of White, Texas-born men and women who were living In the West during the 2000 Census. This plot confirms the decreasing population trend in Figure 1, showing a gradually aging population. This shows the baby-boomers when they were primarily ages 40-49, yet exemplifies a decrease in the populations of the younger cohorts.
Figure 4:
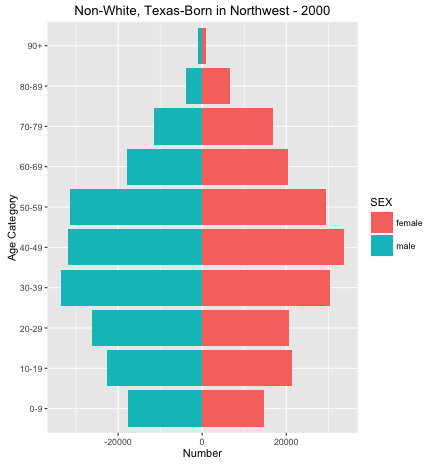
Figure 4 shows a population pyramid for Non-White, Texas-born individuals living in the West during the 2000 census. This is an example of a slightly more “normal” age structure, showing a larger population of individuals between the ages of 30 and 60. However, this pyramid shows the same trend of smaller populations in the younger cohorts, despite the fact that the Western population of Non-White individuals had increased significantly two decades prior. This phenomena in both figures 3 and 4 could be a factor of Tolnay et al.’s discovery that people were more likely to migrate, and at greater distances, had they been without children.
Figure 5:
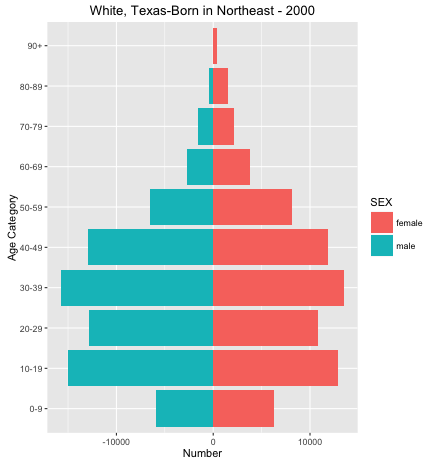
Figure 5 shows a population pyramid for White, Texas-born individuals living in the Northeast in the year 2000. This plot shows a younger age structure than both figures 3 and 4. Yet, the significant drop in the number of children age 0-9 suggests that there is a similar decrease in the population in the youngest cohort.
Figure 6:
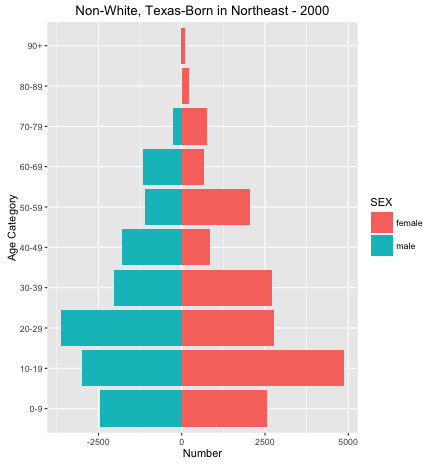
Figure 6 shows the population age structure for Non-White, Texas-born individuals living in the Northeast in 2000. Somewhat due to the low number of respondents, this plot shows a highly irregular demographic structure. However, the same trend of fewer-than-normal individuals occupying the youngest cohort that is evident in the previous population pyramids is again present in this iteration.
Tolnay et al. found that individuals moving from the South to other regions of the country during the Great Migration were more likely to do so before having children. These plots show a similar trend extending past the Great Migration and into the 21st century, with little differentiation between the region to which they moved, the race of the individual, or the sex of the individual. Individuals are still more likely to migrate before having children, and it is most likely that their children are not seen in the plots present here.
Conclusion:
Studies of the Great Migration found significant racial differences in migratory trends throughout the period. Although the Great Migration this study has shown that there continue to be racial differences in migratory trends from Texas-born individuals moving to the West. This trend of decreasing migration from the White cohort and increasing migration from the Non-White cohort could be the result of numerous factors that have yet to reveal themselves to historians. It is important to note that this study only considers the migration of Texas-born individuals. Further research may be done into the migration trends of individuals from the greater-South region to the west.
As for my family, it seems we were a relatively unusual bunch. Most migrants from Texas to the Northeaster and Western regions of the country have shown to do so without or before having children. It seems now that it was uncommon for my parents to decide to have me before moving to the Northeast, even after the Great Migration ended.
Works Cited:
Tolnay, Stewart E., Katherine J. Curtis White, Kyle D. Crowder, and Robert M. Adelman. “Distances Traveled during the Great Migration.” Social Science History Soc. Sci. Hist. 29.04 (2005): 523-48. Web.
Ngai, Mae M. “The Architecture of Race in American Immigration Law: A Reexamination of the Immigration Act of 1924.” The Journal of American History 86.1 (1999): 67-92. Web.