

The 1924 Immigration Act restricted immigration into the United States to 150,000 a year based on quotas (Ngai 1999, 67). Mae Ngai argues that “while not subject to numerical quotas or restrictions on naturalization, Mexicans were profoundly affected by restrictive measures enacted in the 1920s, amend them deportation policy, the creation of the Border Patrol, and the criminalization of unlawful entry” (Ngai 1999, 71). The repeal of these acts in 1965 allowed more immigrants from many countries, including those in Africa and Asia. This act did not help immigrants from Mexico legally enter the U.S., however. Douglas Massey and Karen Pren argue that “the surge in immigration from Latin America occurred in spite of rather than because of the new system” (Massey 2012, 1) I will be examining how first generation Mexican immigration changed in the U.S. between 1950 and 2000 to see how their numbers in the U.S. change relative to immigrants from other countries, as well as where they settle.
Data and Methods
In order to analyze the immigration patterns of people born in Mexico, I used Integrated Public-Use Microdata Series (IPUMS) 1% samples from 1950-2000. For the 1970 data, I used the 1% metro form 1 sample, and for 1980, I used the 1% metro sample.
I use PERWT to calculate the number of people born in Mexico in each state in each year. The IPUMS variable BPL represents the birthplace of each observation. The values of BPL include all 50 U.S. states, as well as U.S. territories, and many countries around the world. For my analysis, I will only be looking at the BPL code corresponding to “Mexico.” This is the main variables I use in my analysis, along with the STATEFIP code of the current location of the individual.
I use the IPUMS data to explore the estimated number of first-generation Mexican immigrants in the United States from 1950 to 2000, the percent of the U.S. foreign-born population born in Mexico over the same time period, as well as the states in which these immigrants settle.
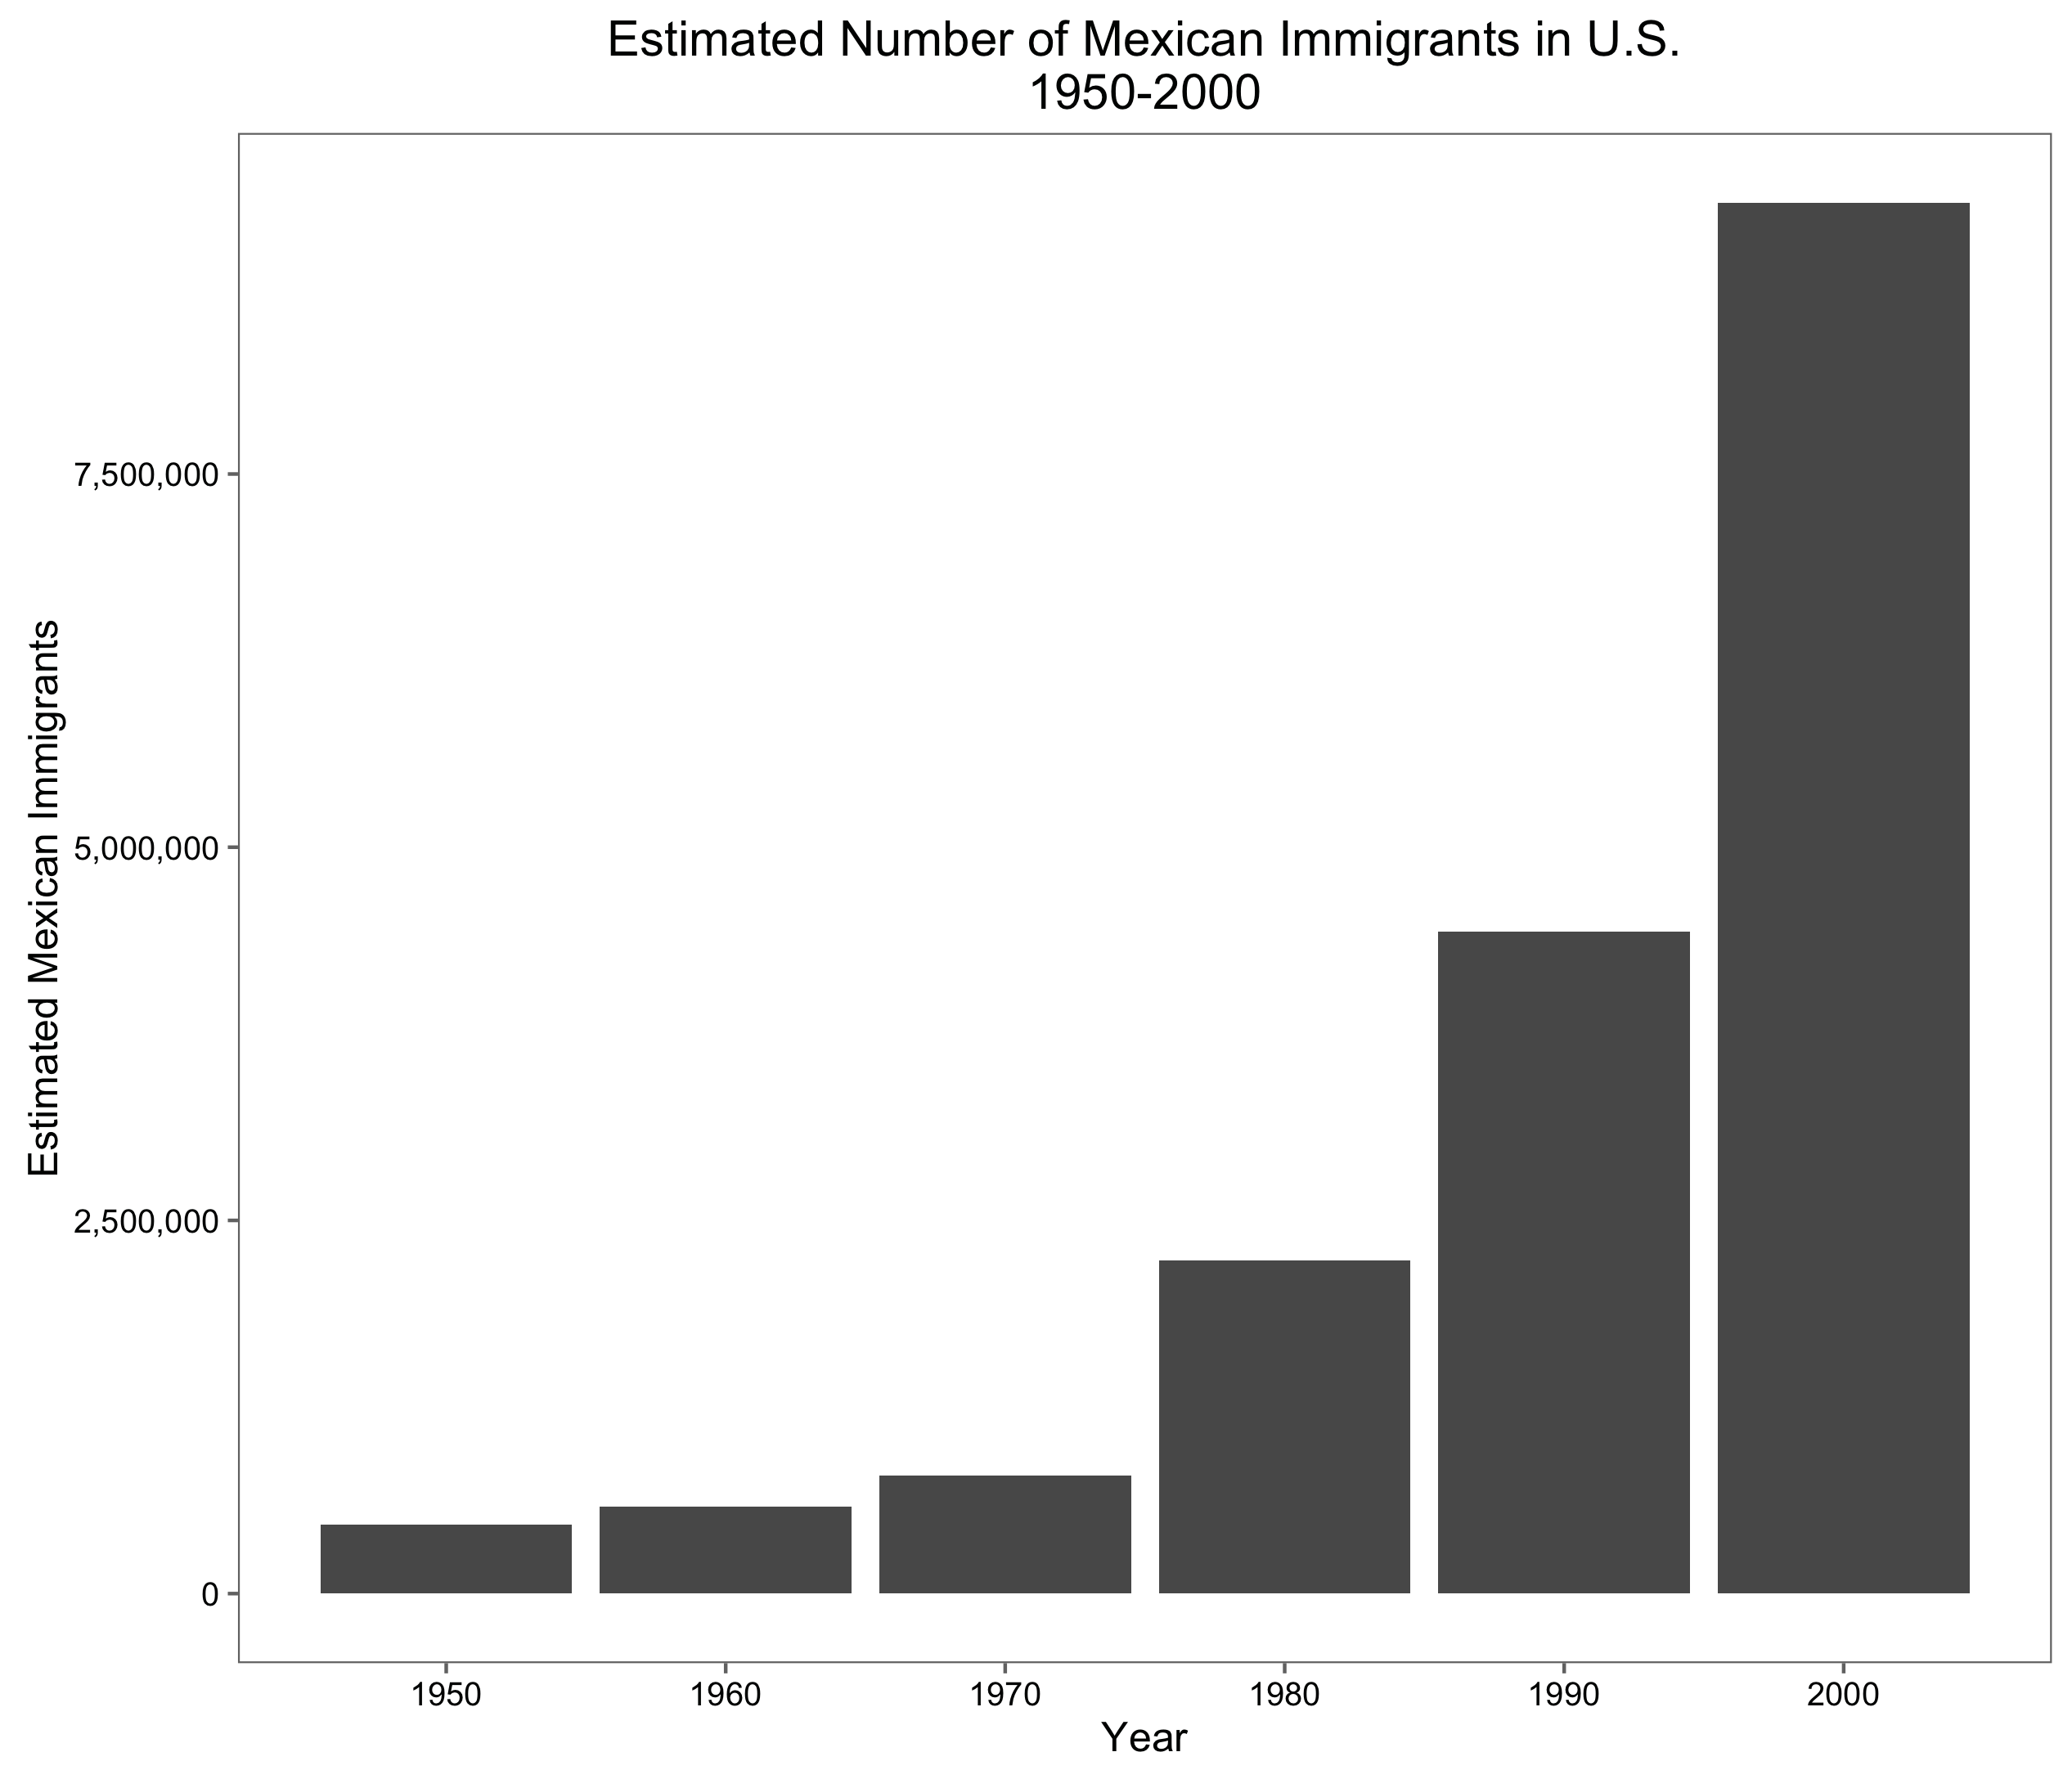
First, in order to get a general idea of how Mexican immigration has changed over time, I calculate both the total number of Mexican immigrants, as well as the percent of foreign-born people who were born in Mexico. Figures 1 and 2 show these results.
After gaining a general understanding of the time trends of Mexican immigration, I break down the data by state to see where these first-generation immigrants settled once they arrived. I calculate the percent of foreign-born people born in Mexico in each state to see where they tended to settle. I do this in for two years, 1950 and 2000 (see Figures 3 and 4). I choose these years because they give two snapshots of Mexican immigration- one before the 1965 Immigration Act and end of the Bracero Program, and another that gives a more modern look at where Mexican immigrants have settled over time. I choose to use the percent of the foreign-born population that is Mexican, rather than the number of Mexican-born U.S. citizens, because I think that is a better metric for showing how the number of immigrants is changing relative to other immigrant populations. Using just the number of Mexican immigrants could be misleading if immigration from other countries is growing as well. Therefore, I look at how the Mexican immigrant population is changing relative to immigration from all other countries. The purpose of the maps is to show regions where immigrants from Mexico were settling in the United States.
In this analysis, I am defining a Mexican immigrant as someone who is born in Mexico who currently lives in a U.S. state. It is important to note that being born in Mexico and moving to the U.S. does not mean they are a Mexican race, or identify as “Mexican.” My results are therefore estimations, and could be biased by those born in Mexico who are not Mexican, and then moved to the United States. It is also impossible to tell from my analysis whether a person was born in Mexico, moved to another country, and then moved to the United States.
The R code I used to generate the results below can be found here.
Results
The number of people who were born in Mexico and lived in the United States at the time of the census, which I am roughly defining as a “Mexican immigrant,” increased exponentially from 1950 to 2000, which is shown in Figure 1. The increase in Mexican immigrant population is steady and gradual until 1980, when the immigrant population more than doubles from the previous census. This doubling pattern continues in 1990 and 2000.
Figure 1:
As I mentioned in the “Methods” section, looking only at the number of Mexican-born people can be misleading because their numbers could grow, while their share of the foreign-born population decreases. To see if the increase in immigration from all countries biases my results from Figure 1, I also observe the percent of foreign-born people born in Mexico by year, shown in Figure 2. Almost the exact same results are shown in Figure 2 as in Figure 1, which means that the Mexican population was increasing relative to the rest of the U.S. foreign-born population. Massey and Pren attribute this increase to illegal immigration and to new family reunification policies, which exempted families of citizens and legal permanent residents from quotas (Massey 2012, 3).
Figure 2:

Figure 3 shows the percent of foreign-born people who were born in Mexico in each state in 1950. In the figure, the states with no Mexican immigrants are shown as white, and the rest of the states’ colors are indicated by the legend. In most states on this map, Mexican immigrants represent less than 10% of the immigrant population of that state. The exceptions are New Mexico, Arizona, California, and Texas.
There are a few explanations for why Mexican immigrants would settle in the Southwest, the most important being proximity to Mexico compounded with costs associated with further travel. Another explanation is the tendency for racial groups to work in the same industries, especially leading up to 1950. Matthew Jacobsen argues that “labor contractors and agents… steered their compatriots toward specific work in specific regions of the United States- … Mexicans [were steered] toward the Texas smelter industry…” (Jacobsen 2000, 67). One mechanism for drawing Mexican immigrants to this area was the Bracero Program, which began in 1942, to help bring in temporary labor to the United States (Massey 2012, 2). Once Mexican immigrants move to a particular area, more immigrants are likely to follow to be reunited with their friends and families.
Figure 3:
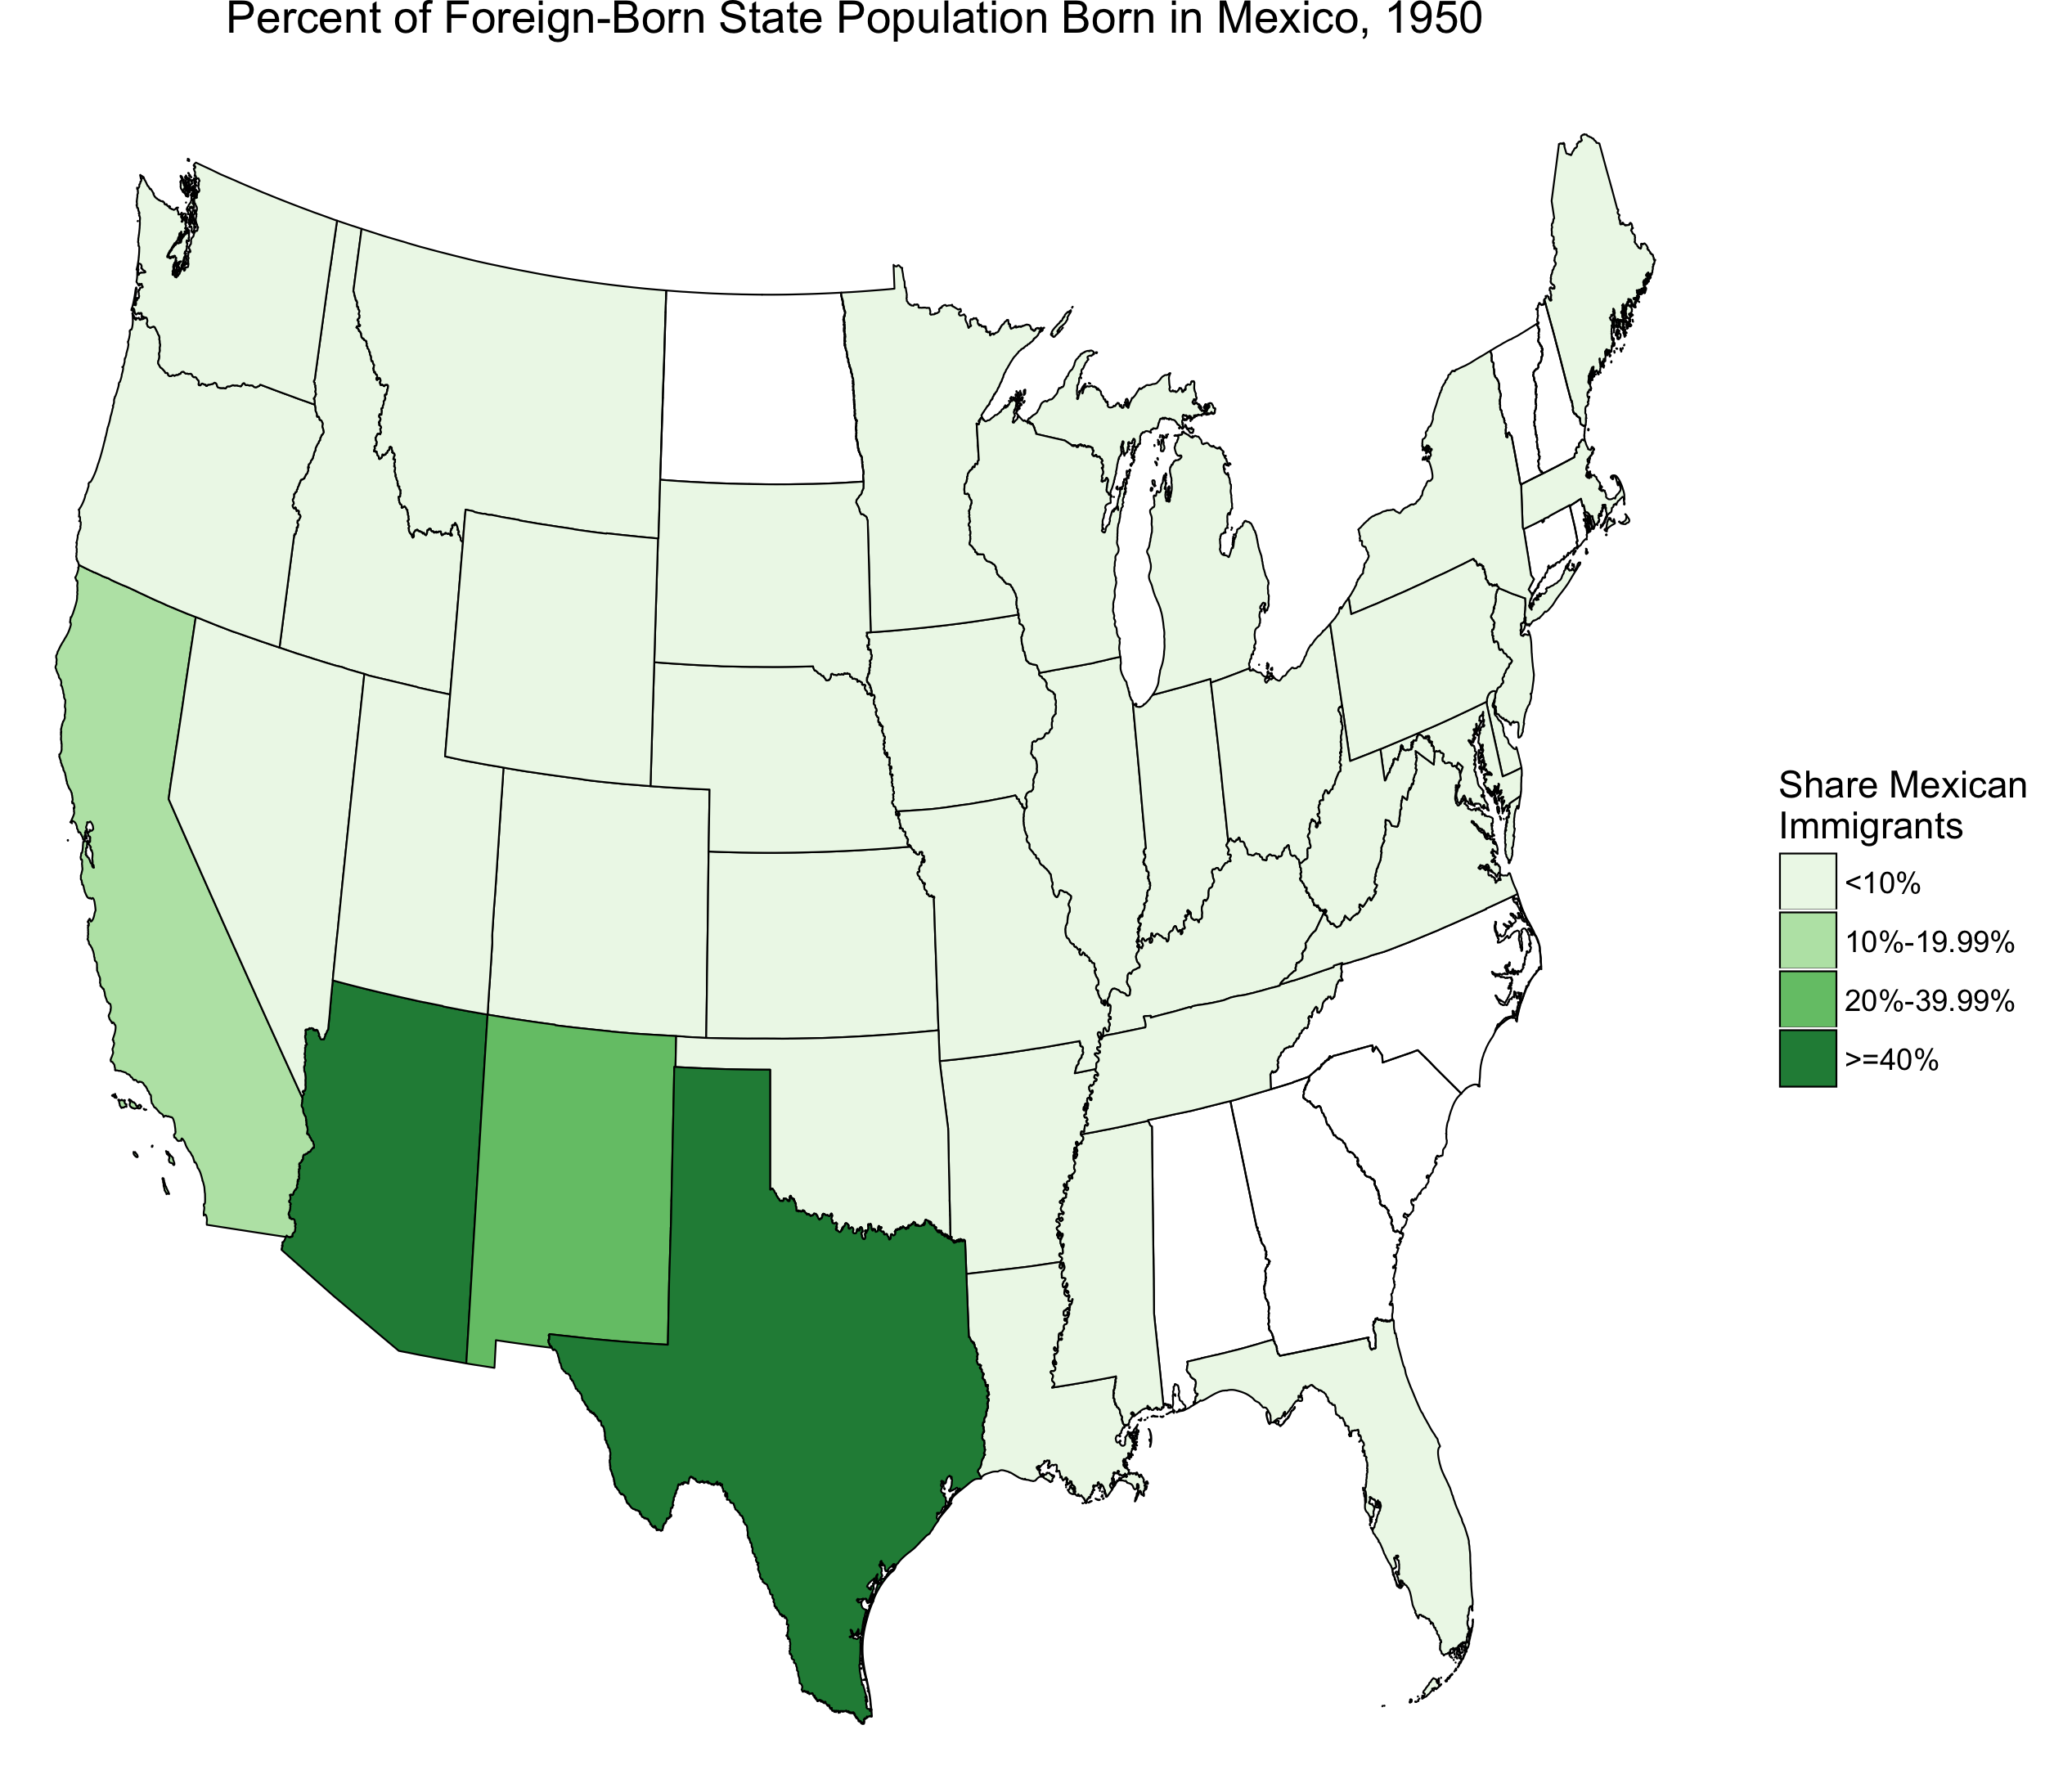
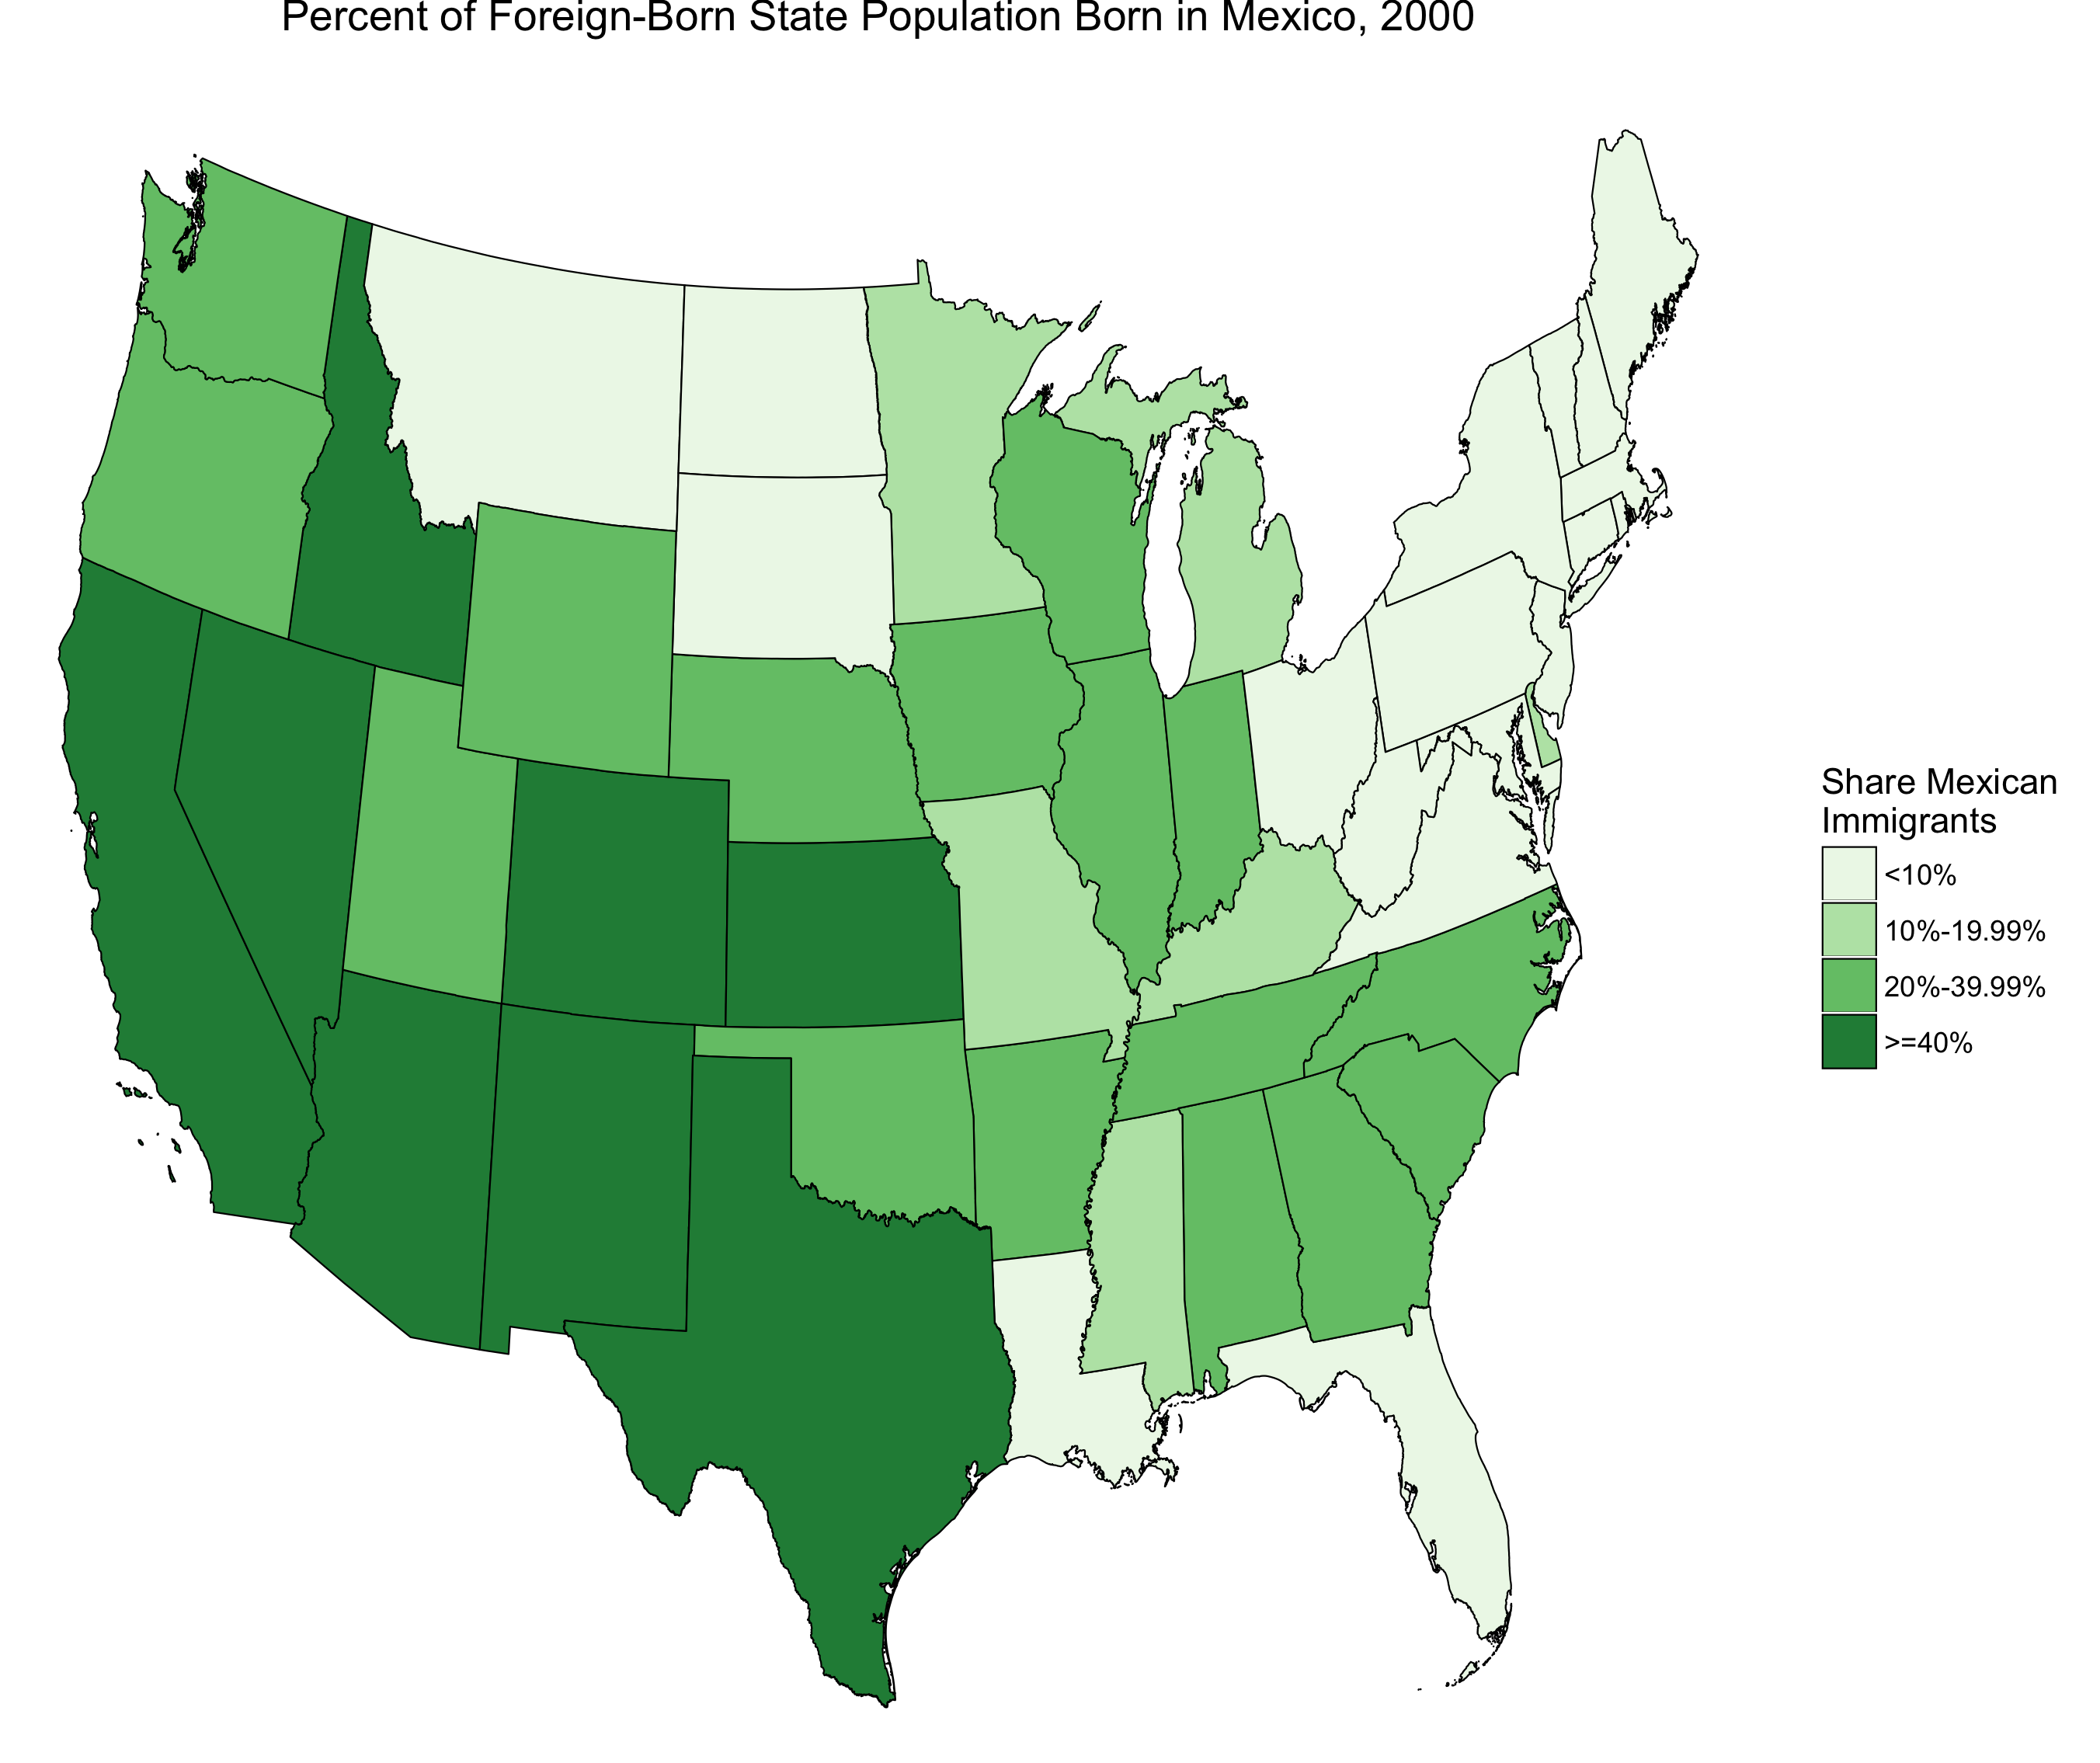
Figure 4 shows a more modern snapshot of first generation Mexican immigration to the United States. It is important to remember that I am only counting individuals who were born in Mexico, so the data that are shown in the map do not represent the children of Mexican immigrants. These children might also consider themselves to be Mexican, but they would not be counted. Therefore, Figures 3 and 4 are underestimating the total Mexican share of the U.S. foreign-born population.
Figure 4 shows similar trends to Figure 3, but on a much larger scale. That is to say, the region of the U.S. settled by first generation Mexican immigrants remained primarily the Southwest, but this area did expand to include more of the Pacific Northwest and a few states the center of the country. In addition, the map scales show that the share of foreign-born people born in Mexico greatly increased in almost all states between 1950 and 2000. California, for example, went from having 10%-20% of the population represent first generation Mexican immigrants in 1950 to over 40% in 2000. In 1950, only four states had over more than 10% of their foreign-born population born in Mexico. In 2000, only a handful of states outside of New England had under 10%.
Figure 4:
Conclusion
The United States saw a large increase in first-generation Mexican immigrants from 1950 to 2000. Both the absolute number and percent of foreign-born immigrants from Mexico increased over these 50 years, which implies that the relative number of Mexican immigrants increased relative to the rest of the foreign-born American population. Most of these immigrants settled in the American Southwest due to its proximity to Mexico, preexisting personal ties to this area, as well as job opportunities presented by the Bracero Program and general demand for inexpensive labor in the area. Although I chose to look at one country in particular, the relative increase in the number of Mexican immigrants reflects the general trend of increasing immigrant populations in the U.S. in the second half of the 20th century.
Works Cited
- Jacobson, Matthew Frye. Barbarian Virtues: The United States Encounters Foreign Peoples at Home and Abroad, 1876-1917. New York: Hill and Wang, 2000. Print.
- Massey, Douglas S., and Karen A. Pren. “Unintended Consequences of US Immigration Policy: Explaining the Post-1965 Surge from Latin America.” Population and Development Review 38.1 (2012): 1-29. Print.
- Ngai, Mae M. “The Architecture of Race in American Immigration Law: A Reexamination of the Immigration Act of 1924.” The Journal of American History 86.1 (1999): 67. Organization of American Historians. Web. 29 Nov. 2013.