

Although the United States was founded as a country of immigrants, government instated immigration policies have been aimed towards the restriction of immigration. In addition to limiting immigration, restrictive legislation also gave rise to illegal immigration (Gabbaccia 2012, 200). The immigration act of 1924 set immigration quotas that limited the number of immigrants to 150,000 people a year (Ngai 1999, 67). However throughout the 1920s male Mexican immigration was unprecedented. The greater majority of Mexican men that immigrated, came alone to work for a period of time with the intention of returning to Mexico after making some money. Then in the 1930s as job prospects fell, Mexican migrant workers followed through with the circulatory migration strategy and repatriated (willingly returned) to Mexico. In 1942 the Mexican and US governments agreed to the “Bracero Program”; This government sanctioned migration policy allowed Mexican migrants to work in the US for a short period of time, after which they were expected to return to Mexico. However, Braceros overstayed their contracts or even crossed the border illegally throughout the 1940s and into the 1950s (Gratton 2013, 946-949). In 1965 when the Amendments to the Immigration and Nationality Act were passed, the Bracero program was terminated and border protection was increased. However instead of limiting the number of illegal immigrants in the United States, the increase in border control drastically curtailed the emigration of illegal Mexican immigrants (Massey 2012, 9). I will analyze the demographic and quantity of Mexican immigration in relation to immigration legislation from 1910 to 1970.
Data:
The data used for this analysis are from the census data available on Integrated Public-Use Microdata Series (IPUMS). My data set is composed of one percent samples from the 1910 to 1970 United States censuses. IPUMS has randomly selected these one percent samples. The IPUMS organized variables BPL, AGE, SEX, PERWT, STATEFIP and YEAR are used for my analysis. Beginning in 1960 the census form is mailed to US residents and as a result all information resulting from the 1960 census onward is self-reported. Before 1960 census data were collected by an enumerator.
For my analysis I exclude data collected in Hawaii and Alaska for all years prior to 1960 because both states were not granted statehood until 1959. I will be using the one percent sample from each of the census years (1% State Form 1 Sample for 1970). Census data from each of my years of interest are collected for individuals not households. All analyses are weighted by PERWT, the sample weight of each individual.
Method:
I begin my analysis with the assumption that the country that a US resident emigrates from is also the country that he or she was born in. Therefore I am identifying immigrant groups by the birthplace (BPL) variable. This is a useful assumption in so far as anyone born in the United States cannot be an immigrant. However when the United States is not the place of birth, birthplace does not necessarily reflect the nationality of the immigrant. Furthermore, birthplace may not necessarily reflect the nation a US resident emigrated from. With that said, I categorized all people who reported the United States as their birthplace together. Then I grouped all people born in Mexico into another category. I also created another category that represents all people reporting birth in a Latin American country. Because Mexico is part of Latin America, I include other Latin American immigration in order to contextualize Mexican immigration. The Latin American category is defined by an IPUMS generated list of countries. Any other reported birthplace is categorized as other.
After graphing the immigrant population over time, I then focussed on the demographic of the Mexican born population. I categorized the AGE variable into ten year age spans (0-9 years old, 10-19 years old, etc.). Then using the SEX variable I divided the data into male or female categories. I summed the population of each age category of both males and females and made a bar graph for each census year. Code for analysis and visualization is available here.
Results:
Figure 1:
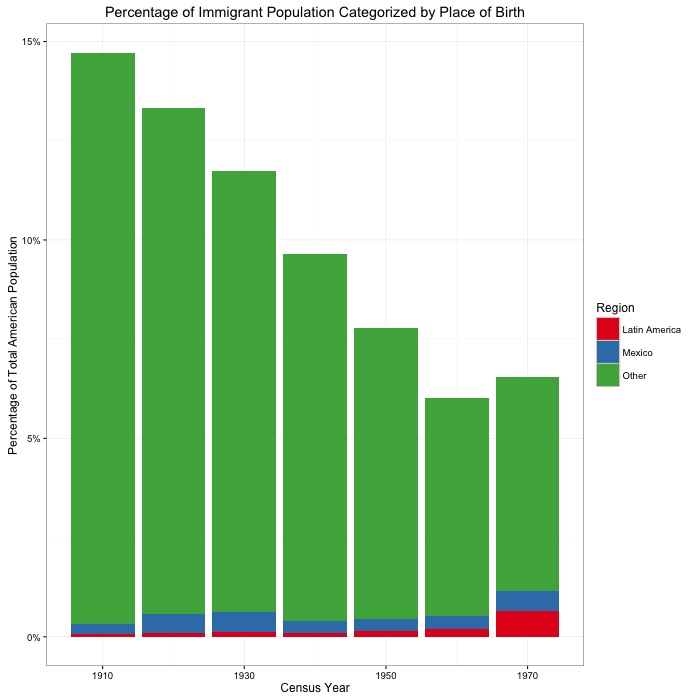
Figure 1 graphs the immigrant population as a percentage of the total american population for each census year from 1910 to 1970. The percent of american immigrants decreases steadily from 1910 to 1960. The percentage of Mexican immigration, however, differs from the larger patterns of american immigration. From 1910 to 1920 of the percent of the american population born in Mexico increases from 0.3% to 0.5%; this remains true into 1930 (percent of the total population that is born in Mexico is still 0.5%). Then from 1940 to 1960 the percent of the population that is Mexican born falls back to 0.3%. In 1970 the percent of Mexican born immigrants rises back to 0.5%. These changes are fairly insignificant in comparison to the larger shift observed among other immigrant groups. Latin American immigration remains fairly consistent at 0.01% from 1910 to 1960; in 1970 this figure increases to 0.6%.
Figure 2:
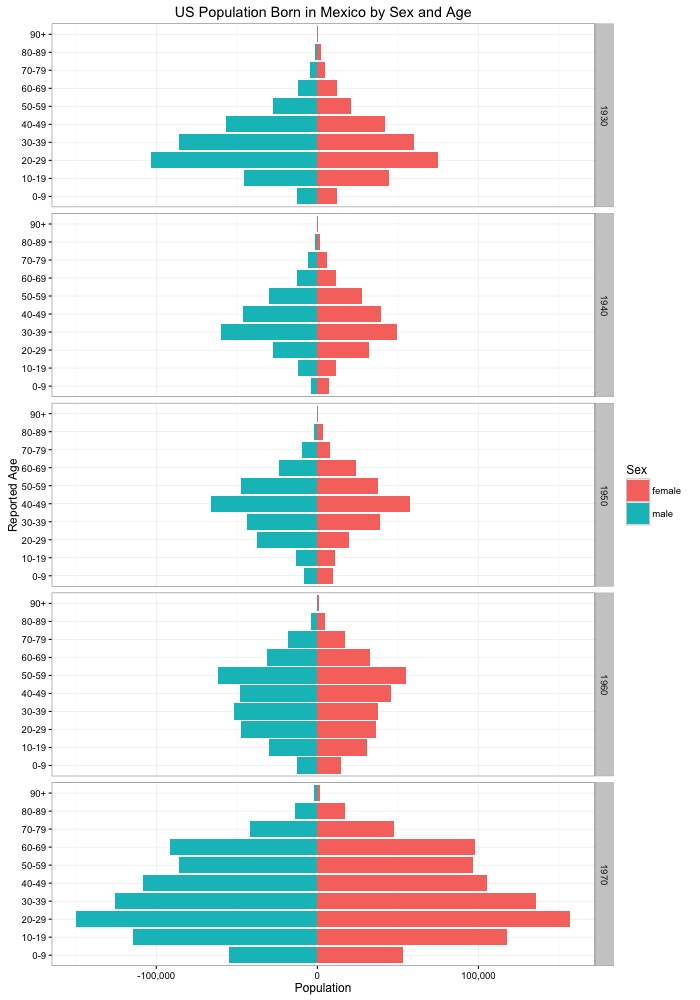
Figure 2 graphs the Mexican born population from 1930 to 1960 according to gender and age. The 20-29 year old male population is the largest male age category in 1930. Starting in 1940 the male population aged 30 to 39 is the largest. Then in 1950 the male population aged 40 to 49 is the largest. This pattern continues into 1960; In 1960 the male population aged 50 to 59 is the largest. The same pattern of population within the male age categories is seen in the female age categories. From 1910 to 1930 women aged 20 to 29 compose the majority of the female population. Then in 1940 women aged 30 to 39 compose the largest female population. In 1950 women aged 40 to 49 are the largest female population. Finally in 1960 the female population aged 50 to 59 is the largest population. For both genders there are relatively fewer people in the extreme high and low age categories; in other words the population in concentrated in the middle-aged categories.
Figure 1 illustrates the percentage of the american population that were Mexican immigrants, and Figure 2 illustrates the changes in Mexican population according to age and gender. As can be seen in figure 2 the majority of Mexican immigrants were male because the majority of them were emigrating to work. The male Mexican immigrants aged 20-29 were the largest age category because they were incentivized to immigrate for work in the US. Men of working age migrated North with the ultimate intention of returning to Mexico. However, starting in the late 1920s the US policy makers “hardened the difference between legal and illegal immigration” and enforced a stricter deportation policy (Ngai 1999, 90). Although the 1930 census report of the Mexican born population does not reflect these historical events, the results of the stricter deportation policy are visible in the 1940 census data. In 1940 men now aged 30 to 39 represent the largest Mexican born generation in the US. All the way through 1960 we can observe the aging of this generation. The immense increase in population in 1970 correlates with the increased border protection starting in 1965. Following the Immigration Act of 1965 Mexican immigrants could no longer cross boarders with ease. We observe a dramatic increase in population among all age and sex categories because people could not return to Mexico (Massey 2012, 9).
Conclusion:
The patterns of population change among those born in Mexico and living in the United States can be explained by changes in immigration legislation. As Brian Gratton and Emily Merchant point out, starting in the 1900s Mexican immigration to the United States grew steadily and ultimately peaked in the 1920s (2013, 947). The duo claims that Mexican migration was a circulatory one consisting mainly of young men looking for temporary work in the United States (2013, 946). However during the great depression employment rates fell and Mexican repatriation prevailed in tandem with stricter deportation policy. Immigration that “averaged 58,747 a year during the late 1920s, dropped to 12,703 in 1930 and 3,333 in 1931” demonstrates a decreasing influx of people (1999, 90).
Following the Immigration Act of 1965 and the termination of the Bracero Program, the new stricter immigration policy resulted in a major increase in Mexican immigration across all Mexican demographics. This significant change in the population is a result of stricter american border patrol. Although estimates of a million illegal immigrants in 1927 still about equaled the estimates of 1971, the illegal immigrants could no longer return to Mexico in 1971 (unlike their counterparts in 1927) (Gabaccia 2012, 200).
Unfortunately the census is only a single snapshot of the population in time. The available census data give us no way of knowing who is a permanent resident and who will eventually emigrate back to Mexico. Furthermore the census gives us know way of knowing which residents are in the US legally and which are not.
Bibliography:
Gabaccia, Donna R. Foreign Relations: American Immigration in Global Perspective / Donna R. Gabaccia. Princeton: Princeton University Press, 2012. Web.
Gratton, Brian, and Emily Merchant. “Immigration, Repatriation, and Deportation: The Mexican‐Origin Population in the United States, 1920–1950.” International Migration Review 47.4 (2013): 944-75. Web.
Massey, Douglas S., and Karen A. Pren. “Unintended Consequences of US Immigration Policy: Explaining the Post-1965 Surge from Latin America.” Population and Development Review 38.1 (2012): 1-29. Web.
Ngai, Mae M. “The Architecture of Race in American Immigration Law: A Reexamination of the Immigration Act of 1924.” The Journal of American History 86.1 (1999): 67-92. Web.