

Since Asian immigrants first arrived on the west coat of the United States just before the Civil War, their journey of racial classification has been a complicated one (Hochschild 2008, 71). Within the past century, the U.S. Census Bureau has changed the number and labels of Asian races on the census almost annually. For example, in the 1850 census, there was no box for any Asian race. In 1870, the only Asian race was Chinese. By 1890, the census distinguished between Chinese and Japanese people, and by 1970, a total of five Asian races were listed. I believe that this evolution can be attributed to two factors. First, the American perception regarding different Asian races changed over time. These views are largely shaped by the historical context surrounding each census, both in the United States, and in the native countries of these Asian groups. How the U.S. government defined race became a question of “who would be allowed to join the insiders of American society rather than being excluded or remaining on the margins as perennial foreigners” (Hochschild 2008, 71). Second, the changes in which Asian races listed on the census reflect the ambiguity in defining what a race actually is, and the difficulty in classifying individuals into such a race. The fact that immigrants from East Asia also had “white” skin further complicated their classification. Kenneth Prewitt argues in his book, What Is Your Race?: The Census and Our Flawed Efforts to Classify Americans, that “the Asian category references neither color nor culture. It is understood in the directive as a catchall racial home” (Prewitt 2013, 101). He then points out that this classification system has not been significantly revisited, arguing “The 1870 decision to racialize these nationality groups and to assemble them in one umbrella category was not questioned a century later” (Prewitt 2013, 102). I use United States census data from 1900 to 1970 to explore the trends in the breakdown of this “umbrella category” because this period of time encompasses a variety of momentous historical events for Asian-Americans, including of the Chinese Exclusion Act, Japanese-American internment, and the Immigration and Nationality Act of 1965.
Data
In order to analyze the classification of Asian races in the U.S. census, I used Integrated Public-Use Microdata Series (IPUMS) 1% samples from 1910-1970. For the 1970 data, I used the 1% State Form 1 Sample.
I use PERWT to calculate the number of people in each racial category in each year. The IPUMS variable RACE is a broad race category and can hold the following values: white, black, IAIN (American Indian or Alaskan Native), Chinese, Japanese, OAPI (Native Hawaiian and Other Pacific Islander), and other. The “other” category is reserved for individuals who are not clearly one of the other races. Depending on the year, the listed races on the census vary. Within each broad race category, IPUMS provides the variable RACED, which reflects the categories used by enumerators and individuals filling in self-report forms. I use RACE to determine who I will include in my analysis, and then I use RACED to see how those people were actually classified in the census. RACED is the main variable I use in my analysis.
Methods
I use the IPUMS data to explore which RACED values are available in which year and why. I also observe the number of individuals in each of those race categories to see how that changes with time.
It is important to note that just because a new race category is introduced in a particular year, that does not mean that that race of people was also new to the United States. Rather, the United States government felt the need to define that race separately in that year. This distinction is important. As I look at trends, I will be considering where the census would have categorized individuals of the newer races in the in the previous census year.
The R code I used to generate the results below can be found here.
Results
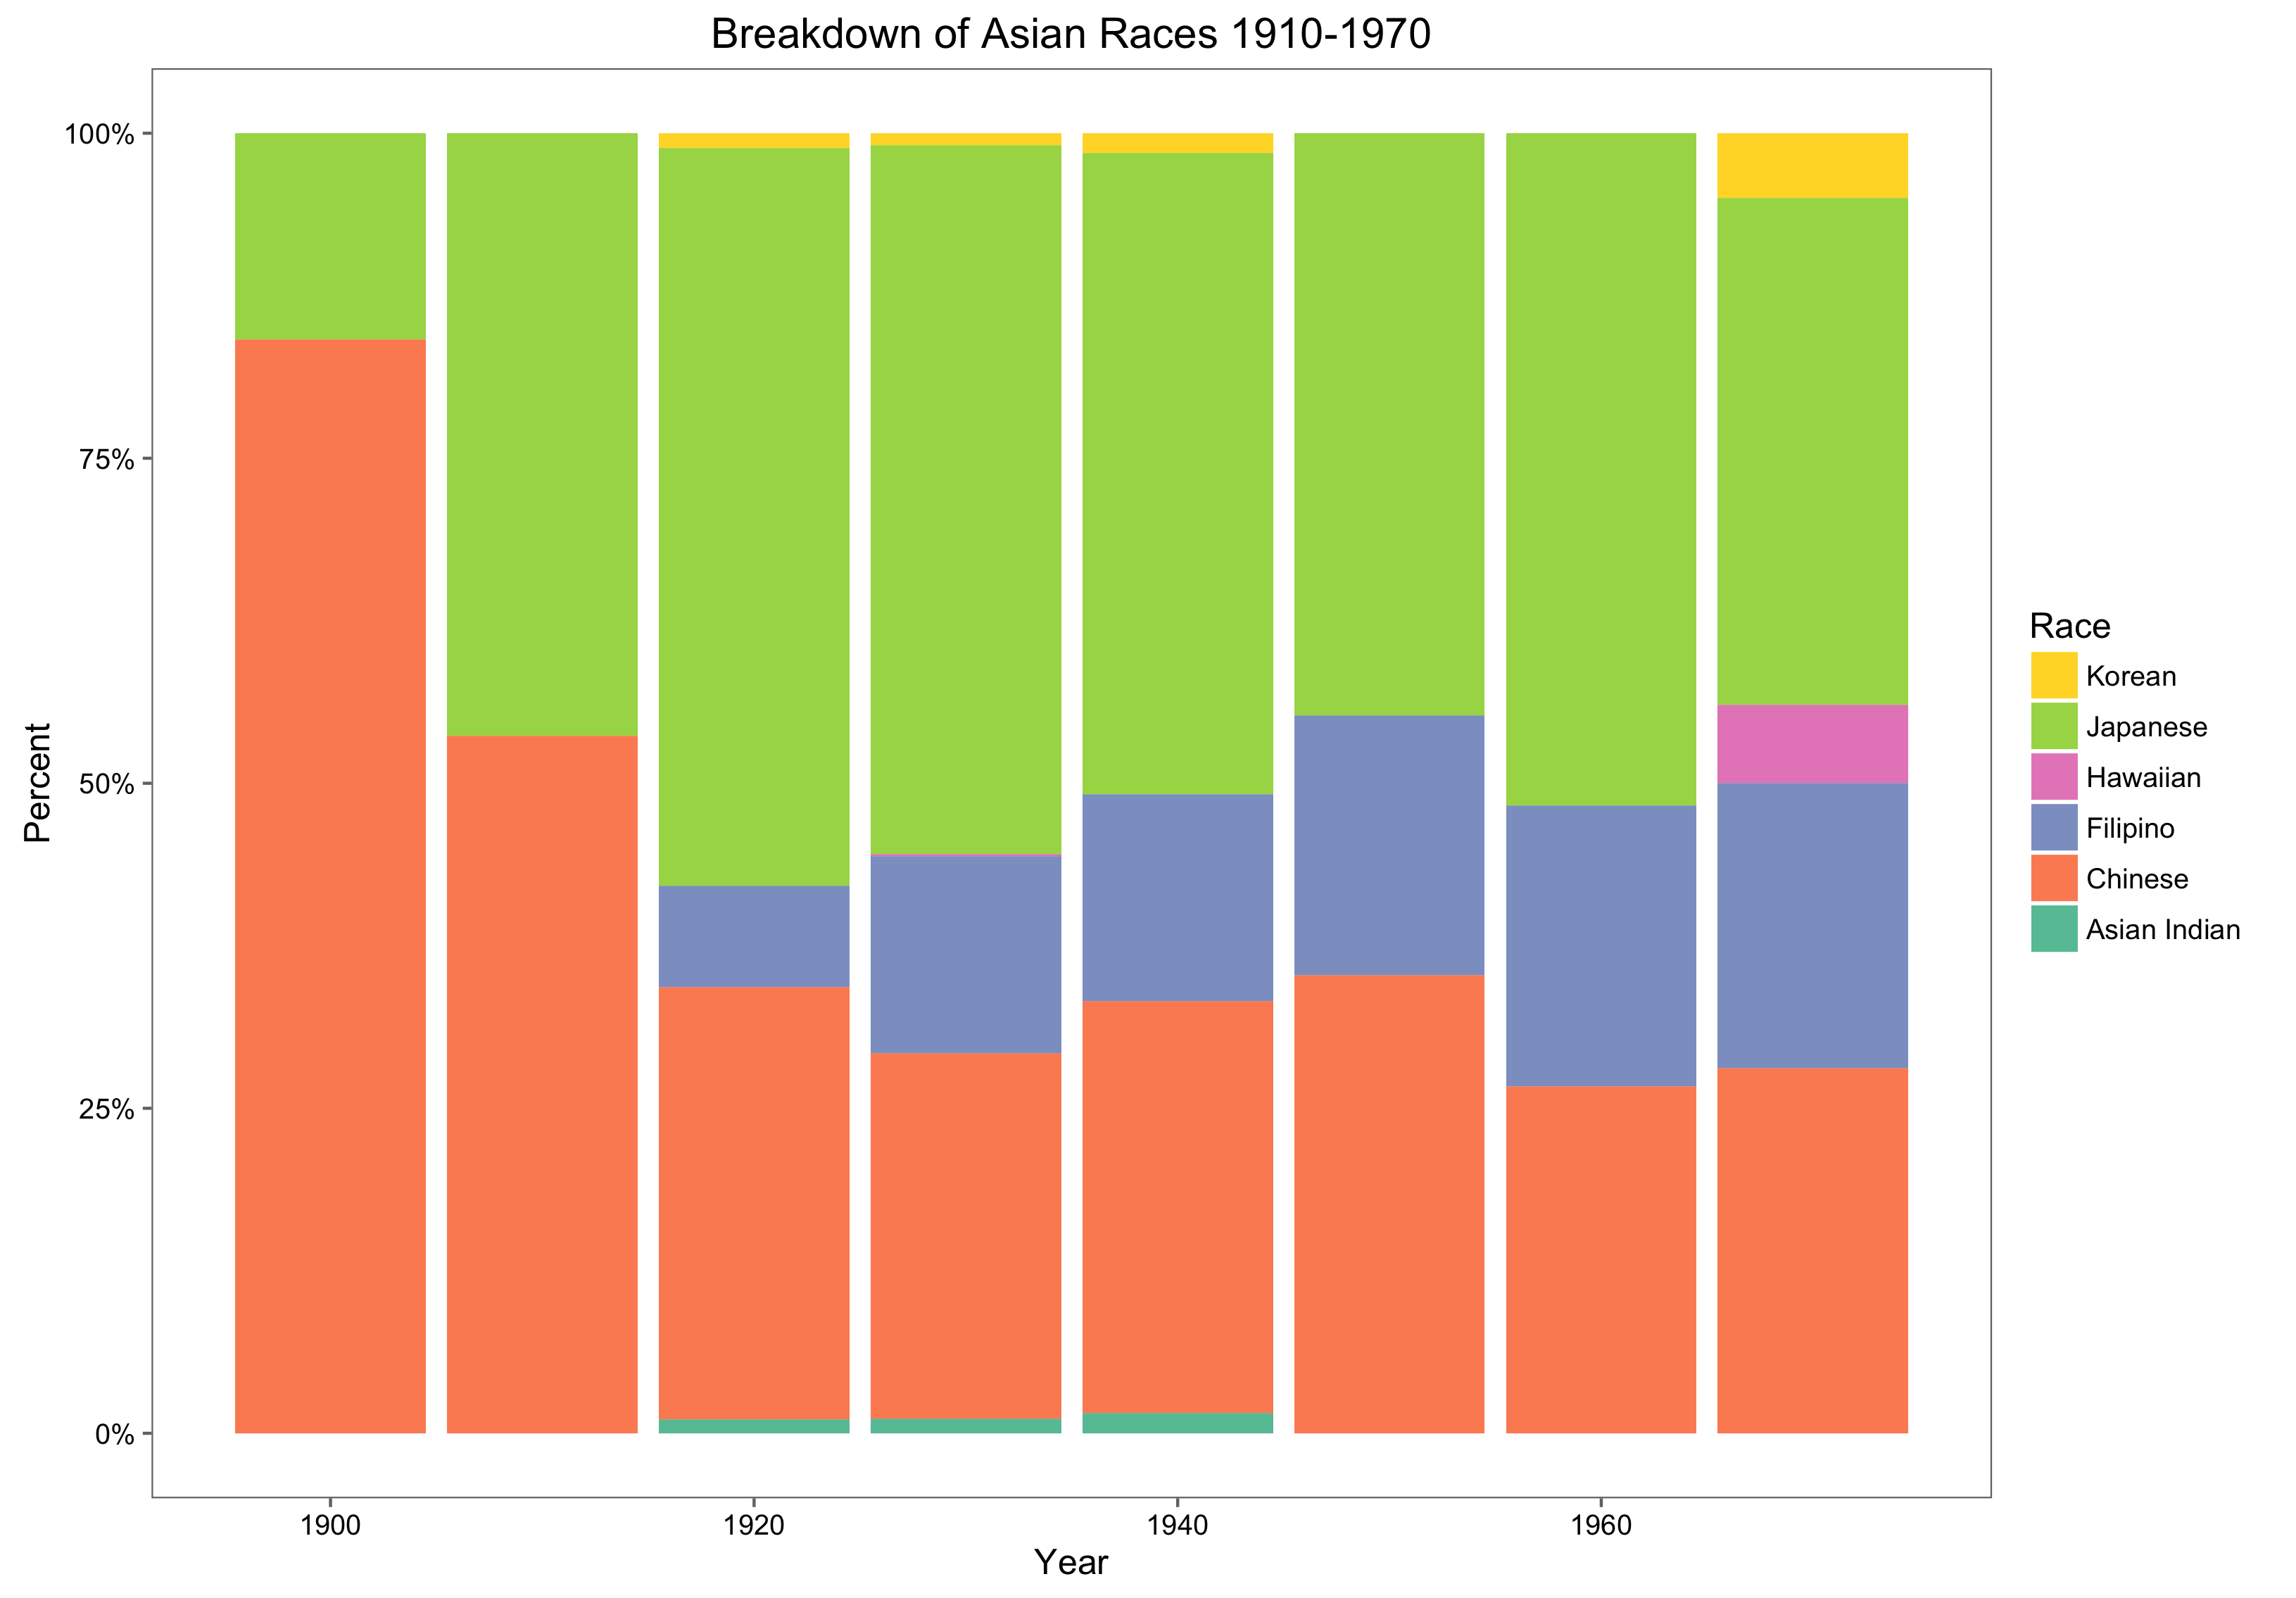
Figure 1 shows how the races listed on the census change over time between 1900 and 1970. The Chinese immigrants who came to the United States in the beginning of the 20th century settled primarily in California for labor purposes. They immigrated to either mine for gold in California, or to be contracted workers building the transcontinental railroad. Americans sometimes, but not always, recruited the latter group of workers while they still lived in China, and then they immigrated once they already had a job. Enumerators counted immigrants from China as white in the 1860 census, except in California, where they counted them as “Asiatic” (Hochschild 2008, 71). As more Eastern Asian immigrants came to the United States, the Census Bureau classified them in order to exclude the newcomers from white privilege. In 1870, “Chinese” appeared on the census alone with white, black, mulatto, and Indian. Enumerators included Japanese people in the Chinese count, but excluded Hawaiians, who were likely counted as white. By 1920, “enumerators were told to distinguish among Chinese, Japanese, Filipino, Hindu, Korean, and Other” (Hochschild 2008, 72), which I show in Figure 1.
Hochschild and Powell argue that census officials never clarified why Asian races were granularly divided by nationality, rather than referring to them as “Asiatics” or “Mongolians.” According to them, “the 1906 Supplementary Analysis on race noted ‘little scientific ground for attempting to discriminate between the Chinese and the Japanese as of different races. They regard themselves and are regarded by ethnologists as closely related branches of the great Mongolian, or yellow, race'” (Hochschild 2008, 73). The court case In re Ah Yup was brought by a man from China with white skin. He argued that Chinese people should be allowed to naturalize because they had white skin. In this case , the Supreme Court relied on race science to differentiate between between “Asiatic” or “Mongolian” and “Caucasian” in order to prevent the extension of white privilege to Asian races. Ah Yup argued that his skin color was white, but the Supreme Court ruled that the ability to naturalize was only granted to Caucasian individuals.
The 1920-1940 censuses list a separate “Hindoo” category (Asian Indian in Figure 1) in order to separate the “white” race from the caucasian, Western European race that had the privilege in the Unites States at the time. In the case of United States v. Thind, the Supreme Court formally banned South Asians from naturalizing as American citizens. The Supreme Court used social science rather than race science to justify this ruling (Hochschild 2008, 73). Race scientists could not explain that South Asians were biologically separate, because the white race originated in South Asia, according to race scientists. In order to justify the separation, proponents of the decision used social science. This was a small racial category, and was only on the census in 1920, 1930, and 1940; then it was removed.
Although some officials viewed individuals from China and Japan as the same, the public generally viewed them as distinct races with different prospects for assimilation. As shown in the figure, the share of Japanese increased between 1900 and 1910, while the Chinese share decreased. Americans regarded Chinese very poorly, while they compared Japanese to Frenchmen, and saw them as much closer in status to the white race. Many policies reflected this poor treatment of Chinese people. The most notable was the Chinese Exclusion Act signed by Chester A. Arthur in 1882, which prohibited all immigration of Chinese laborers, who were inexpensive at the time. The United States government made the “temporary” act permanent in 1902, until they finally repealed in 1943. In Figure 1, the Chinese population share increases between the 1940 and 1950 census for that reason.
Figure 1:
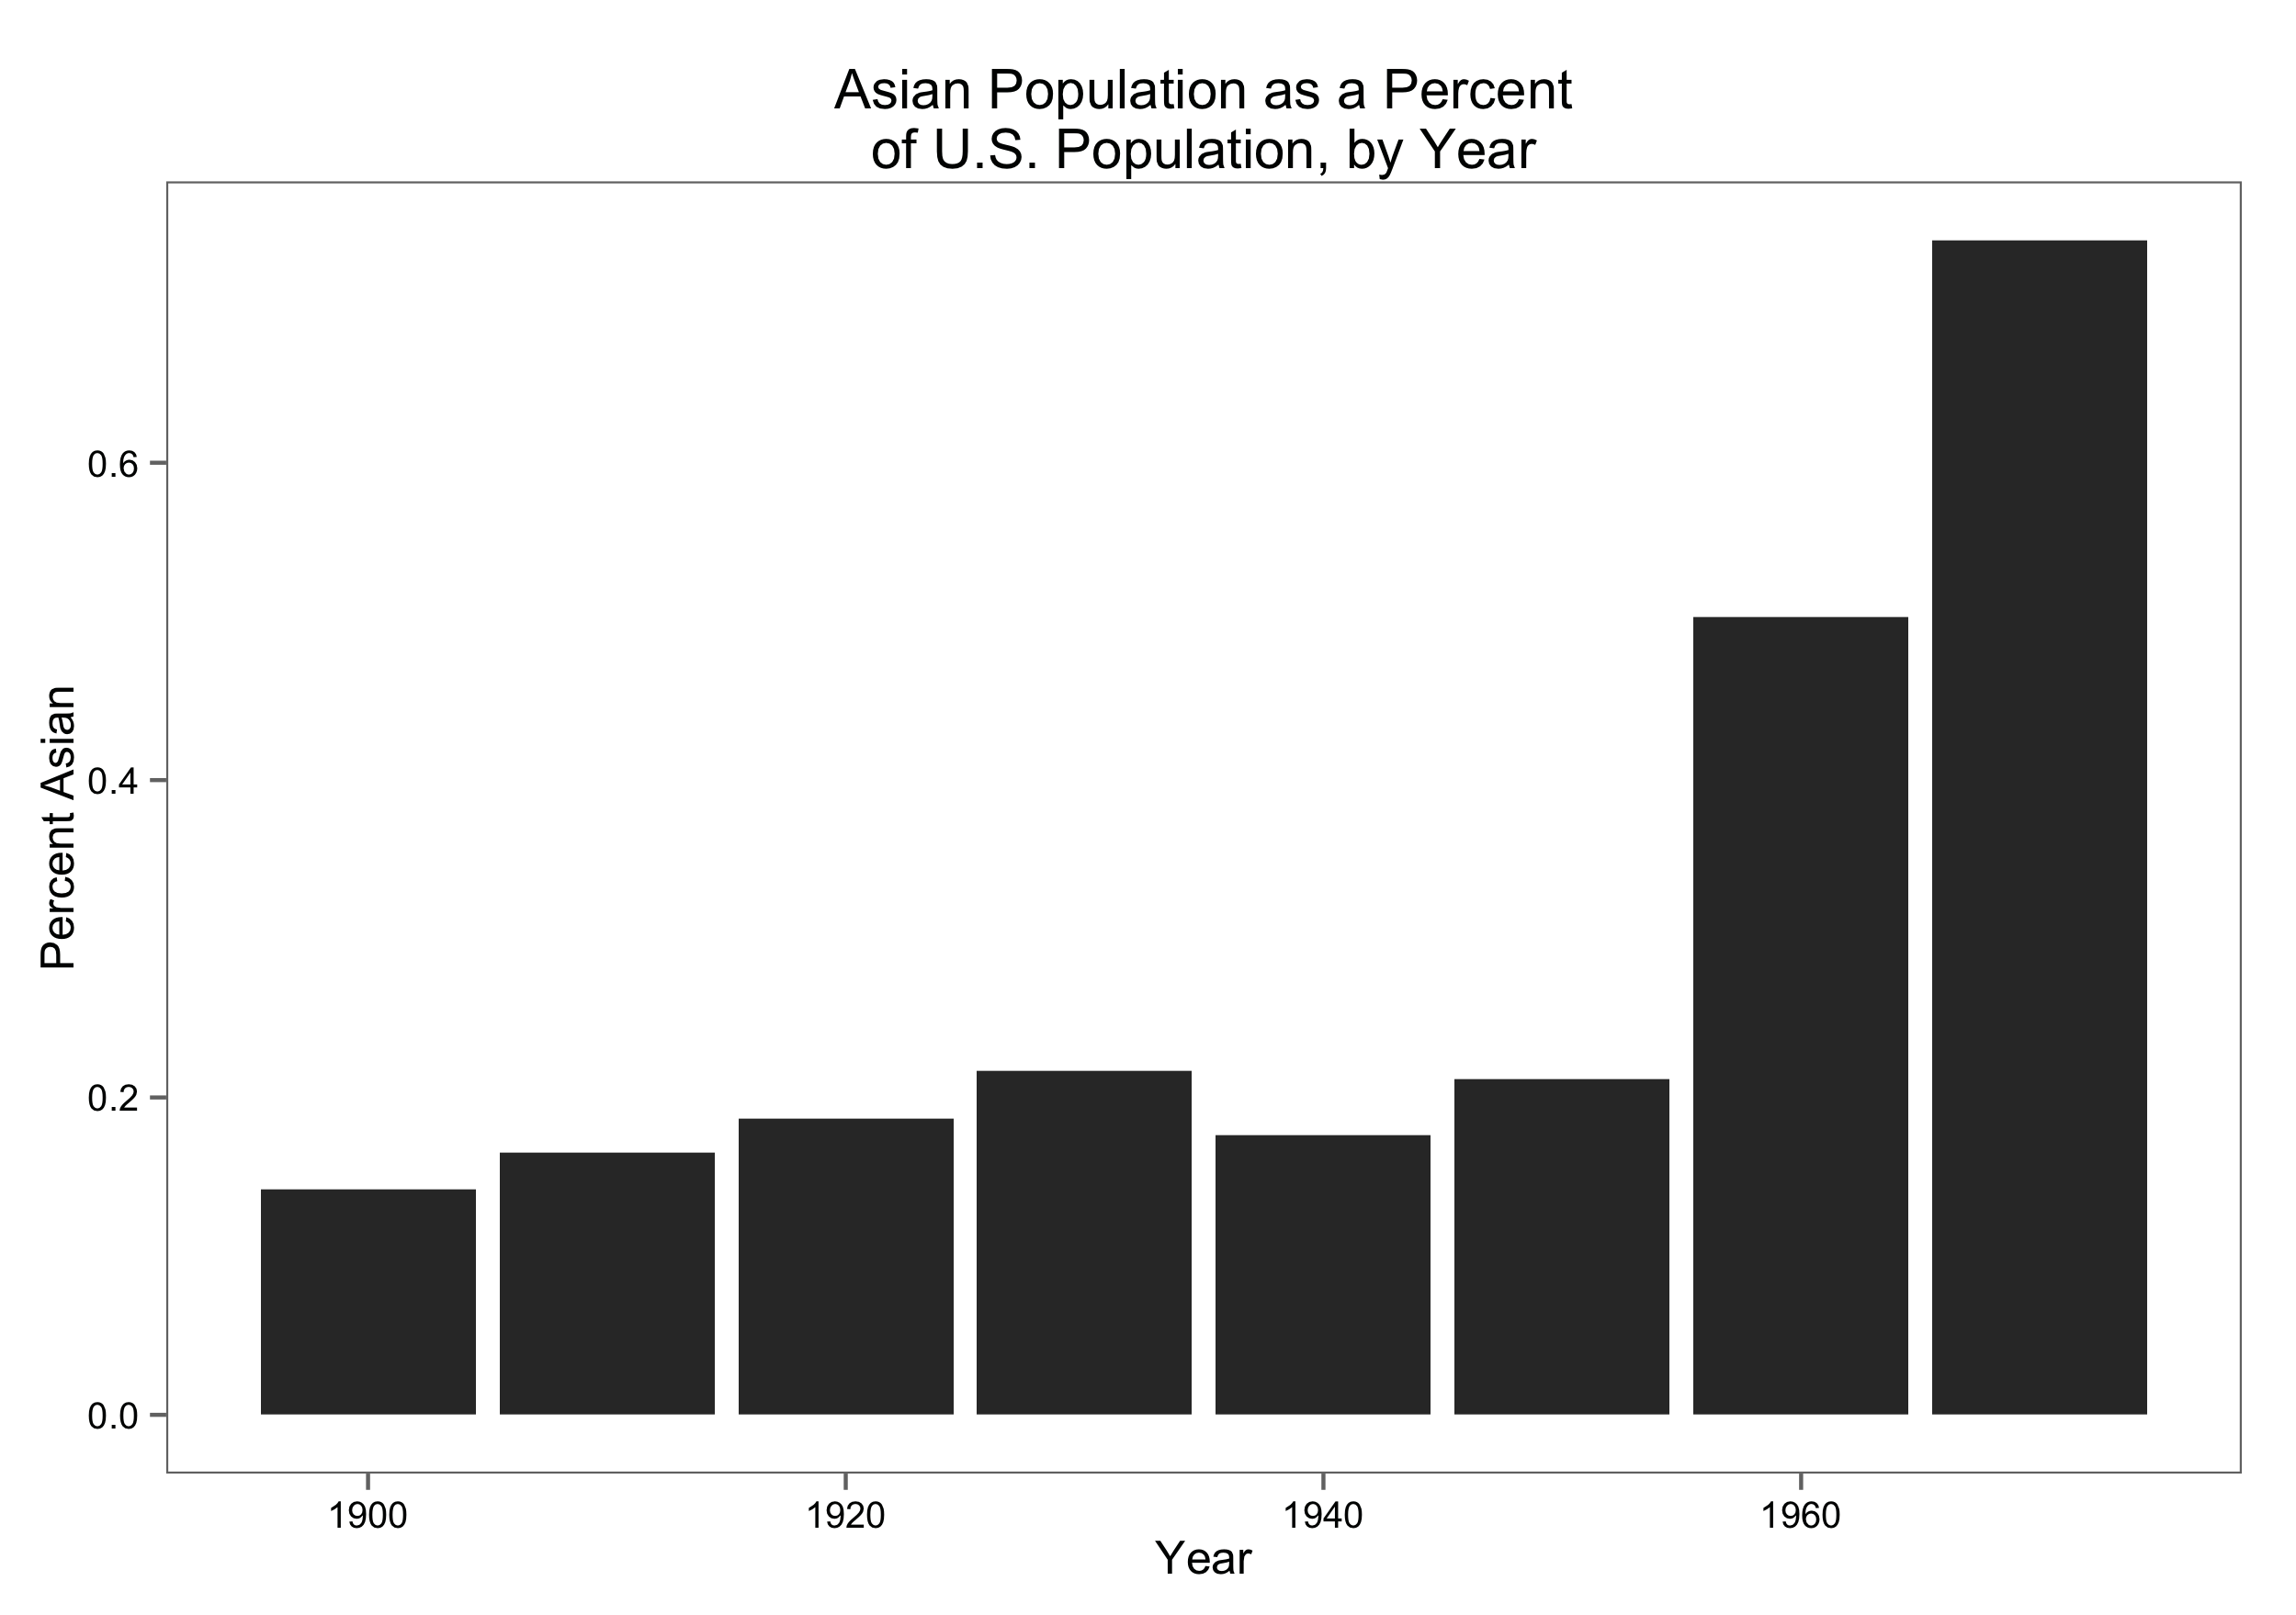
It is not only important to observe which races the census listed, but also to explore the number of individuals enumerators counted in each. Figures 2 and 3 show the number of people categorized in Asian races and the percent of the U.S. population categorized in Asian races over time, respectively. They show similar trends. Between 1900 and 1930, there is a steady increase in both the absolute Asian population, as well as the Asian share of the U.S. population. There was then a dip in 1940, likely due to the 1924 Immigration Act, which greatly restricted the number of new immigrants to the U.S.. In the 1970 census, there is a sharp increase in the number and share of Asian races by nearly double. This increase can be attributed to the 1965 Immigration and Nationality Act, which abolished the U.S. quota system, therefore allowing more immigrants from Asian countries. It is also important to note that although the share of the Asian population increased over this time period, their total share of the U.S. population was quite small, only reaching about 0.8% in 1970.
Figure 2:

Figure 3:
Conclusion
The Asian races in the United States experienced many changes from the 1850’s to now. I examined the period between 1910 and 1970 because it highlights some key moments of classification, and therefore inevitable discrimination, of different Asian populations. These classifications reflect the government of the United States just as much, if not more, than it reflects the Asian populations, because it shows us who the government wanted to define, and therefore exclude, from certain rights. The Asian race is also interesting to observe because it shows the shift from race science to social science as a means of classifying and “othering” different cultural groups to continue the American tradition of white privilege.
Works Cited
- Prewitt, Kenneth. What Is Your Race?: The Census and Our Flawed Efforts to Classify Americans. Princeton, NJ: Princeton UP, 2013. Print.
- Hochschild, Jennifer L., and Brenna Marea Powell. “Racial Reorganization and the United States Census 1850–1930: Mulattoes, Half-Breeds, Mixed Parentage, Hindoos, and the Mexican Race.” Stud. in Am. Pol. Dev. Studies in American Political Development 22.01 (2008): 59-96. Print.