

As early as 1900, statisticians associated with the U.S. Census Bureau were aware of the tendency of respondents to misreport their age or the age of those for whom they were responding in the census (Young 1900). One of the most common types of age misreporting is “age heaping,” which demographer Melvin Zelnik described in 1961 as “the recognized phenomenon of people reporting themselves at an age other than, but close to, their true age, as for example, the preference for ages ending in 0 and 5” (Zelnik 1961, 540). In his analysis of the 1880-1950 censuses, Zelnik calculated the percent by which native-born white men and women over- or under-stated each age from 5 to 85, demonstrating that age heaping is a much more complicated phenomenon than a simple “preference for ages ending in 0 and 5.” Indeed, in the 1950 census, Zelnik found that men and women close to the age of 65 were more likely to claim that age; the same was true among women close to the age of 85, while men close to that age were less likely to claim it. Preference for ages ending in 0, meanwhile seemed to increase with age for both men and women, though men close to ages 20 and 30 seemed to have actually avoided stating those ages (Zelnik 1961, 564). In this post, I take a new look at age heaping in the U.S. Census, examining samples from the Integrated Public-Use Microdata Series (IPUMS) for 1850 to 2000. Like Zelnik, I do not identify a simple “preference for ages ending in 0 and 5.” Moreover, the age preferences I do find seem to diminish over time.
Data
Data for this analysis are drawn from the Integrated Public-Use Microdata Series (IPUMS). I use 1% samples for the censuses of 1850-1880 and 1900-2000 (samples for 1890 are not available; for 1970 I use the 1% State Form 1 sample, and for 1980 I use the 1% Metro samples). For 1850-1860, these samples include only free individuals. Prior to 1900, they exclude “Indians not taxed.” In contrast to Zelnik, who examined only native-born men and women between ages 5 and 85, I include all individuals in these samples under age 80. Age was top-coded at 90 in 1980, and at 100 in 1960 and 1970. Limiting my analysis to individuals under age 80 allows me to avoid distortions in the data caused by top-coding and to avoid to some degree distortions caused by higher mortality at older ages (for example, while we could assume that mortality would cause little difference between the number of individuals at ages 21 and 22, it would cause a much larger difference between the number of individuals at ages 81 and 82). The IPUMS variables AGE and SEX indicate self-reported age and sex; PERWT indicates the sample weight of each individual. All analyses described below are weighted by PERWT
Method
I begin with the assumption that the last digit of age should be relatively evenly distributed over the population (that is, there should be relatively similar numbers of people with age ending in 0, 1, 2, etc.). Clearly, this assumption is rather crude. As already mentioned, within any decade of age (e.g. 20s, 30s, etc.), mortality will have taken a higher toll at the older ages than at the younger ages. Inter-annual fluctuations in fertility will also cause some cohorts to be larger and others smaller. Summing across all decades of age by last digit (that is, adding individuals age 1 to individuals age 11 to individuals age 21, etc.) smooths out much of the variability between ages caused by variations in fertility, though the effects of mortality will likely reduce the proportion of the population in the higher “last digits” (that is, we expect more people to have a last digit of 3 than a last digit of 8 simply because more people live to age 23 than 28, 43 than 48, 73 than 78, etc.). As stated above, limiting the analysis to individuals under 80 reduces this source of deviation from even distribution. It must also be remembered that IPUMS data are samples, and are thus subject to sampling error (https://usa.ipums.org/usa/chapter3/chapter3.shtml).
In this analysis, I calculate the last digit of each person’s age by dividing by 10 and taking the remainder, using the remainder function in R (LAST <- AGE%%10). The number of people in each last-digit category are summed by year and sex and divided by the total number of people of each sex in each year. Finally, I graphed the percentage of individuals by sex in each last-digit category in each year. Code for analysis and visualization is available here.
Results
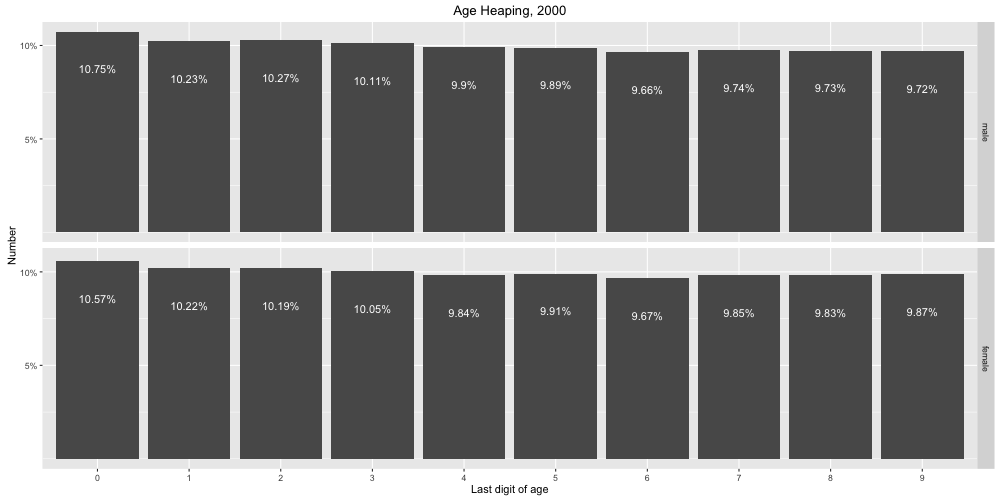
Figure 1. Last digit of age as a percentage of total population, by sex, for the census of 2000. Image created by author using data from www.ipums.org.
Figure 1 graphs the distribution of the population over last digit of age by sex for the 2000 census. In general, the distribution over age categories is fairly even, though we do see more people in the lower numbers than the higher numbers, as we would expect from the uneven effects of mortality. However, mortality should produce a steadily declining proportion of the population in each last-digit category. Instead, we see a lower percentage of the population with last digit 6 than last digit 7, 8, or 9, for both men and women, suggesting that individuals with a last digit of 6 might be rounding their ages down to an age ending in 5. We also see a somewhat higher proportion of individuals at ages ending in 0 than at any other age, indicating a slight preference for these ages. The preference seems to be greater among men than among women, and for women we also see a higher proportion at ages ending in 9 than ages ending in 6, 7, or 8, suggesting that women might be more likely to round their ages down from years ending in 0 to the previous year ending in 9. Among men, we see a lower percentage with ages ending in 1 than with ages ending in 2, suggesting a preference to round down ages ending in 1 to the previous year ending in 0.
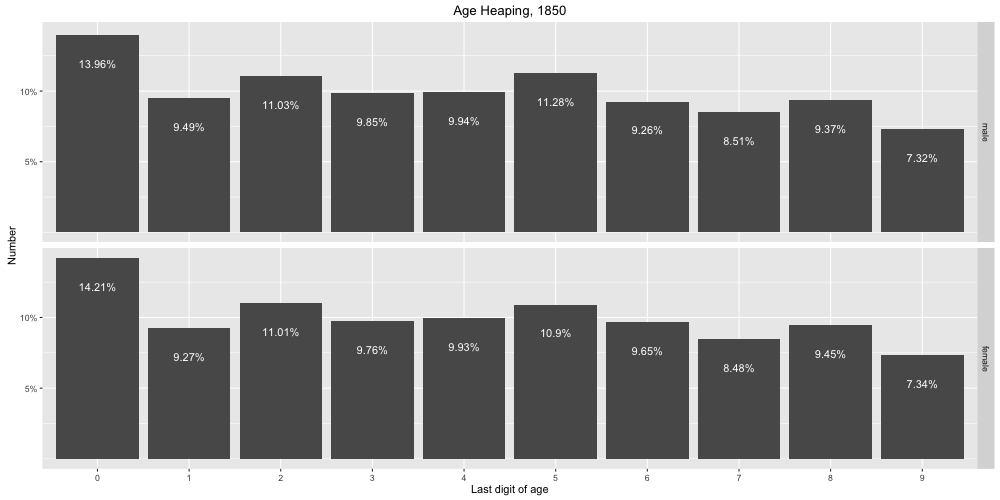
Figure 2. Last digit of age as a percentage of total population, by sex, for the census of 1850. Image created by author using data from www.ipums.org.
Figure 2 graphs the distribution of the population over last digit of age by sex for the 1850 census. These results are markedly different from those for the 2000 census. Here we see much more unevenness among last-digit categories. There is a marked tendency to round ages to years ending in 0 for both men and women, as well as a less-marked tendency among both sexes to round ages to years ending in 5 and 2, with 2 more prevalent among women and 5 more prevalent among men. Both genders more likely to report ages ending in 8 than 7, suggesting that some people with ages ending in 7 rounded their ages up, while it is also likely that some of them rounded their ages down. Overall, in 1850, the age distribution suggests a preference for ages ending in 0, 2, 5, and 8 and an avoidance of ages ending in 1, 7, and 9.

Figure 3. Last digit of age as a percentage of total population, by sex and census year, for the censuses of 1850-1880 and 1900-2000. Image created by author using data from www.ipums.org.
Figure 3 graphs the distribution of the population over last digit of age by sex for all censuses from 1850-1880 and 1900-2000. The same preferences and avoidances that appear in 1850 continue to appear in subsequent years, but become less marked over time, with the distribution of the population over last-digit categories substantially evening out by the mid-twentieth century. In 1960, for the first time for women, no category contains more than 11% or less than 9% of the population; the same is true of men for the first time in 1970.
Conclusion
Three factors likely account for the diminishment of age heaping over time. The first is growing numeracy or literacy with numbers. Patricia Cline Cohen (1983) has argued that Americans were a particularly numerate people from the early years of the Republic, when numbers became a source of authority in the policy arena. However, prior to the twentieth century, age mattered little, and people were asked their ages on fairly rare occasions. Documentation of age was also much harder to come by, as birth certificates, drivers’ licenses, and passports did not yet exist. However, the twentieth century saw not only the proliferation of such documentation, but also new legal rights and privileges that were tied to age, such as driving and drinking (voting was always age-delimited). A second factor that likely accounts for the diminishment of age heaping in the twentieth century is the reduction in household size. Census data are collected at the level of the dwelling unit and, prior to 1960, were reported by whoever happened to be home when the enumerator came to the door. Modell and Hareven (1973) have demonstrated that, prior to the twentieth century, few people lived alone and many households included lodgers or servants. It was therefore less likely that anyone who answered the door when the enumerator knocked would be able to accurately report the ages of every person in the dwelling unit. The practice of lodging, however, came under attack from the new family experts of the Progressive Era at the beginning of the twentieth century, and by the second half of the century, the proportions of single-individual households had grown dramatically (Modell and Hareven 1973). Finally, the introduction of the mail-back form in 1960 may also have increased the accuracy of age reporting, as enumerators may in earlier censuses have relied on neighbors to supply information for dwelling units where no residents were home.
Works Cited
- Cohen, Patricia Cline. 1983. A Calculating People: The Spread of Numeracy in Early America. Chicago: University of Chicago Press.
- Modell, John and Tamara K. Hareven. 1973. “Urbanization and the Malleable Household: An Examination of Boarding and Lodging in American Families.” Journal of Marriage and Family 35(3): 467-479.
- Young, Allyn A. 1900. “Age,” pp. 130-174 in Supplementary Analysis and Derivative Tables, Twelfth Census of the United States. Washington, D.C.: U.S. Bureau of the Census.
- Zelnik, Melvin. 1961. “Age Heaping in the United States Census: 1880-1950.” The Milbank Memorial Fund Quarterly 39(3): 540-573.