

Introduction
It is common to hear the statistic that “fifty percent of marriages will end in divorce.” The fact is, divorce is quite common in the present day. In this post, I explore two questions. First, I look at how the presence of divorce among families with children changes over time. Second, I look at how divorce differs based on child age and race. Because divorce deeply affects children, I frame my analysis at the individual child level. In other words, I look at how the number of children living with divorced parents changes over time. I believe it is more impactful to do individual-level analysis, as opposed to household-level analysis, because in doing so, I gain a better understanding of the number of children affected by divorce.
Data
In order to analyze the changes in the number and percent of children living with at least one divorced parent, I use Integrated Public-Use Microdata Series (IPUMS) 1% samples from 1940-2000. For the 1970 data, I use the 1% State Form 1 sample, and for the 1980 data, I use the 1% metro sample.
In my analysis, I include all individuals between ages 0 and 17, using the IPUMS variable AGE. I include these ages because children in this age range are likely to still be living at home with their parents. Since most kids leave home at the age of 18, a large portion of that age would be lost from my sample because they would not be living with a parent. Therefore, I do not include people who were 18 at the time of each census.
I only include households with fewer than 5 unrelated people living there (IPUMS variable GQ = 1). All analysis are weighted by the IPUMS variable PERWT.
Methods
To match a child to the parent(s) with which he or she is living, I use the IPUMS pointers MOMLOC and POPLOC. These variables are constructed by IPUMS to locate an individual’s mother and father person number within the household (Ruggles 1995, 52). Using the variable MARST, I check to see if either parent the child lives with is currently divorced (MARST = 4). If a child lives alone, or with no parents, I count them as not living with a divorced parent. If a child only lives with one parent, I see if that parent is divorced, and if so, I count that child as living with a divorced parent. In other words, the child needs to be living with at least one divorced parent to count in the “divorced” category. Most children living with a divorced parent do not live in two-parent households. More specifically, they are more likely to be living with their mother because a “predominant pattern of mother custody” during this time period (Goldscheider 2001, 489)
Because I only observe if the adult is currently divorced, I do not count adults who are remarried as divorced. A child could live with his father and his step-mother, and although the father was once divorced from the child’s biological mother, this child would not be counted as living with a divorced parent. Therefore, my estimations of the number of children living with divorced parents are likely underestimates of the true number.
It is important to note that I am not counting the number of divorces over time. Because I am looking at the data at the individual child level, it is possible, and quite likely, that one divorce results in multiple children living with a divorced parent. If a parent has multiple children at the time of his or her divorce, all of those children would be counted as separate observations in my data.
In my analysis, I first look at time trends in the data. I observe the number of children living with at least one divorced parent between 1940 and 2000. Because the population of the United States grows over that time period, and fertility changes over time, I also look at the percent of children ages 0-17 living with a divorced parent over time.
After gaining a general understanding of how the number of children of divorce change over my time period of interest, I break the data down by race and age to see if the trends differ across these variables. I separate all individuals into two race categories: white and non-white. The non-white category includes Hispanic people (HISPAN = 1), and the while category includes all individuals listed as white on the census (RACE = 1), besides the Hispanic population. I also broke down my data into three even age groups: ages 0-5, 6-11, and 12-17. I chose these age groups because I wanted each category to contain the same number of ages, which is six years in this case. I would expect to see more divorces as a child ages, because parents of young children are more likely to still be married than parents who have been together longer, and have not recently had children.
The R code I used to generate the results below can be found here.
Results
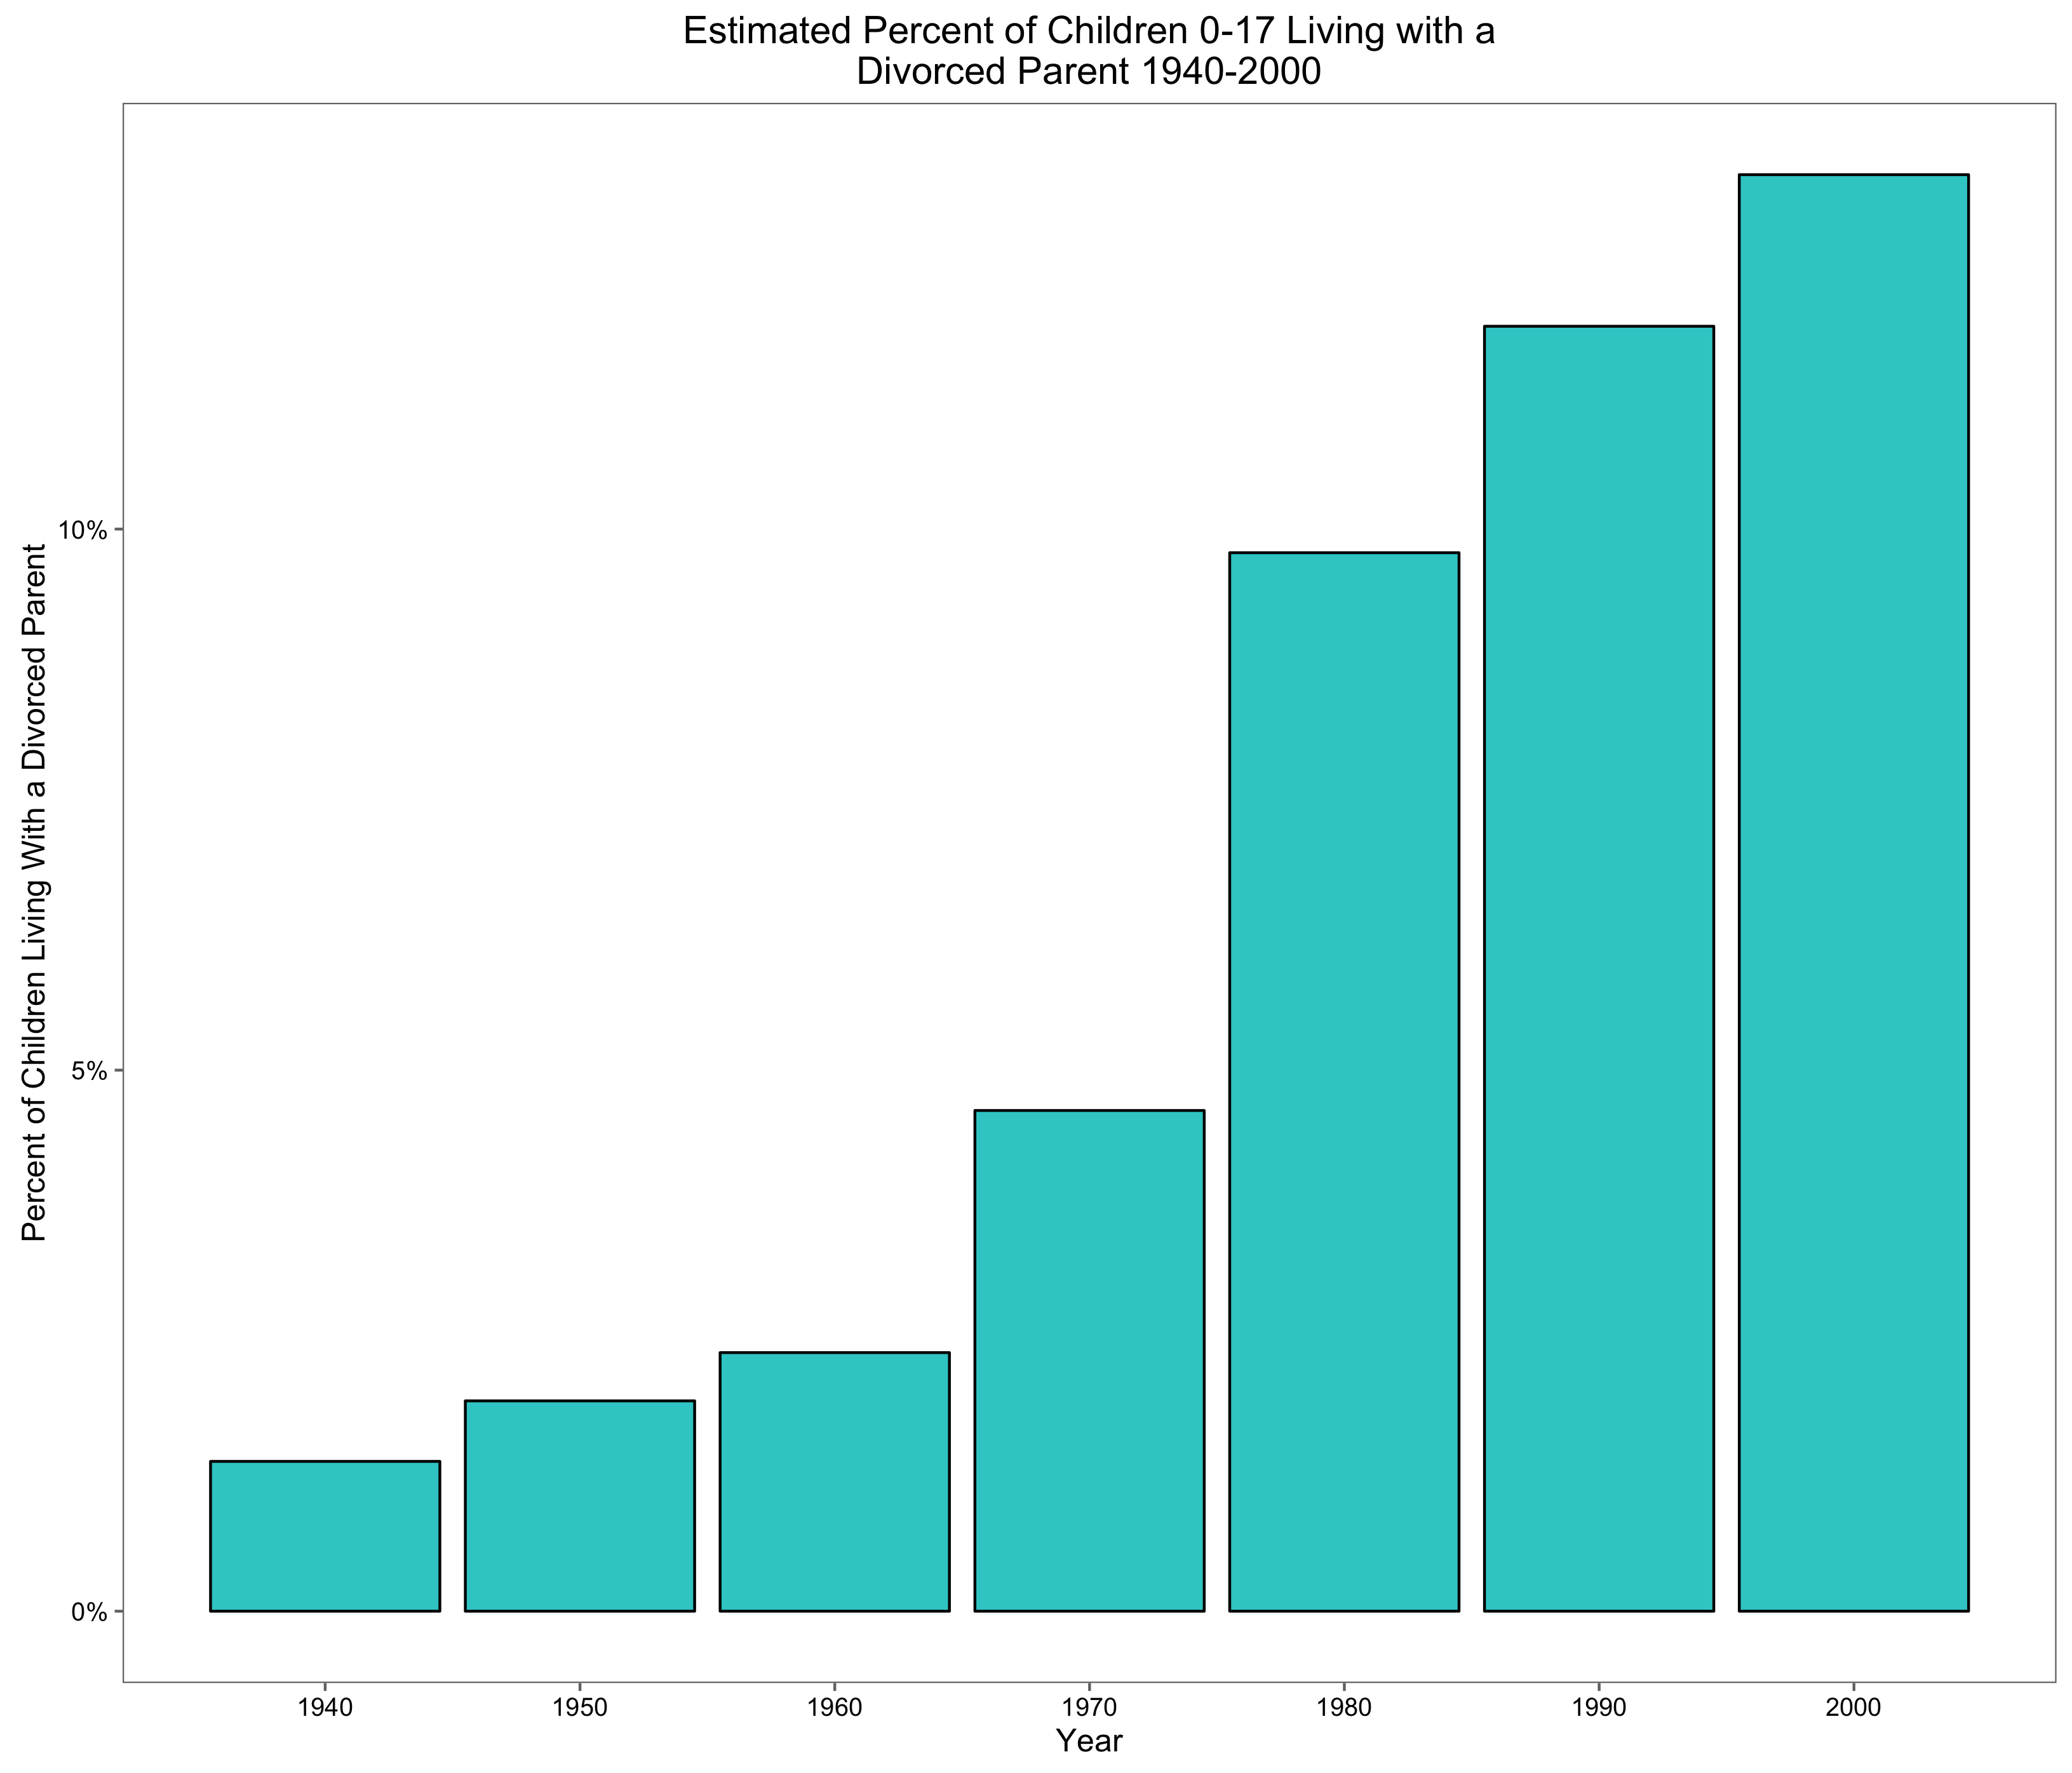
Figure 1 shows the number of children living with a divorced parent in the United States between 1940 and 2000. As the figure shows, there is a steady increase between 1940 and 1960. Between 1960 and 1980, the number of divorces doubles in each census year. After 1980, the number of divorces increases at a slower rate. Figure 2 shows the percent of children living with divorced parents from 1940 to 2000. The trends shown in Figure 2 are nearly identical to Figure 1, which implies that children of divorce grew as a total proportion of children over this time period. In 1940, only around 2% of children lived with a divorced parent. In 2000, that figure reached almost 15%.
These patterns could have several explanations. First, the social emphasis on the nuclear family peaked in the 1950’s. Since then, there is much less of a social stigma associated with getting divorced. Second, there could be external factors compelling couples to divorce in the latter half of the century. Tamara Hareven attributes these family “breakdowns” to pressures of urban life or migration, both of which increase after 1950 (Hareven 1974, 325).
Figure 1:
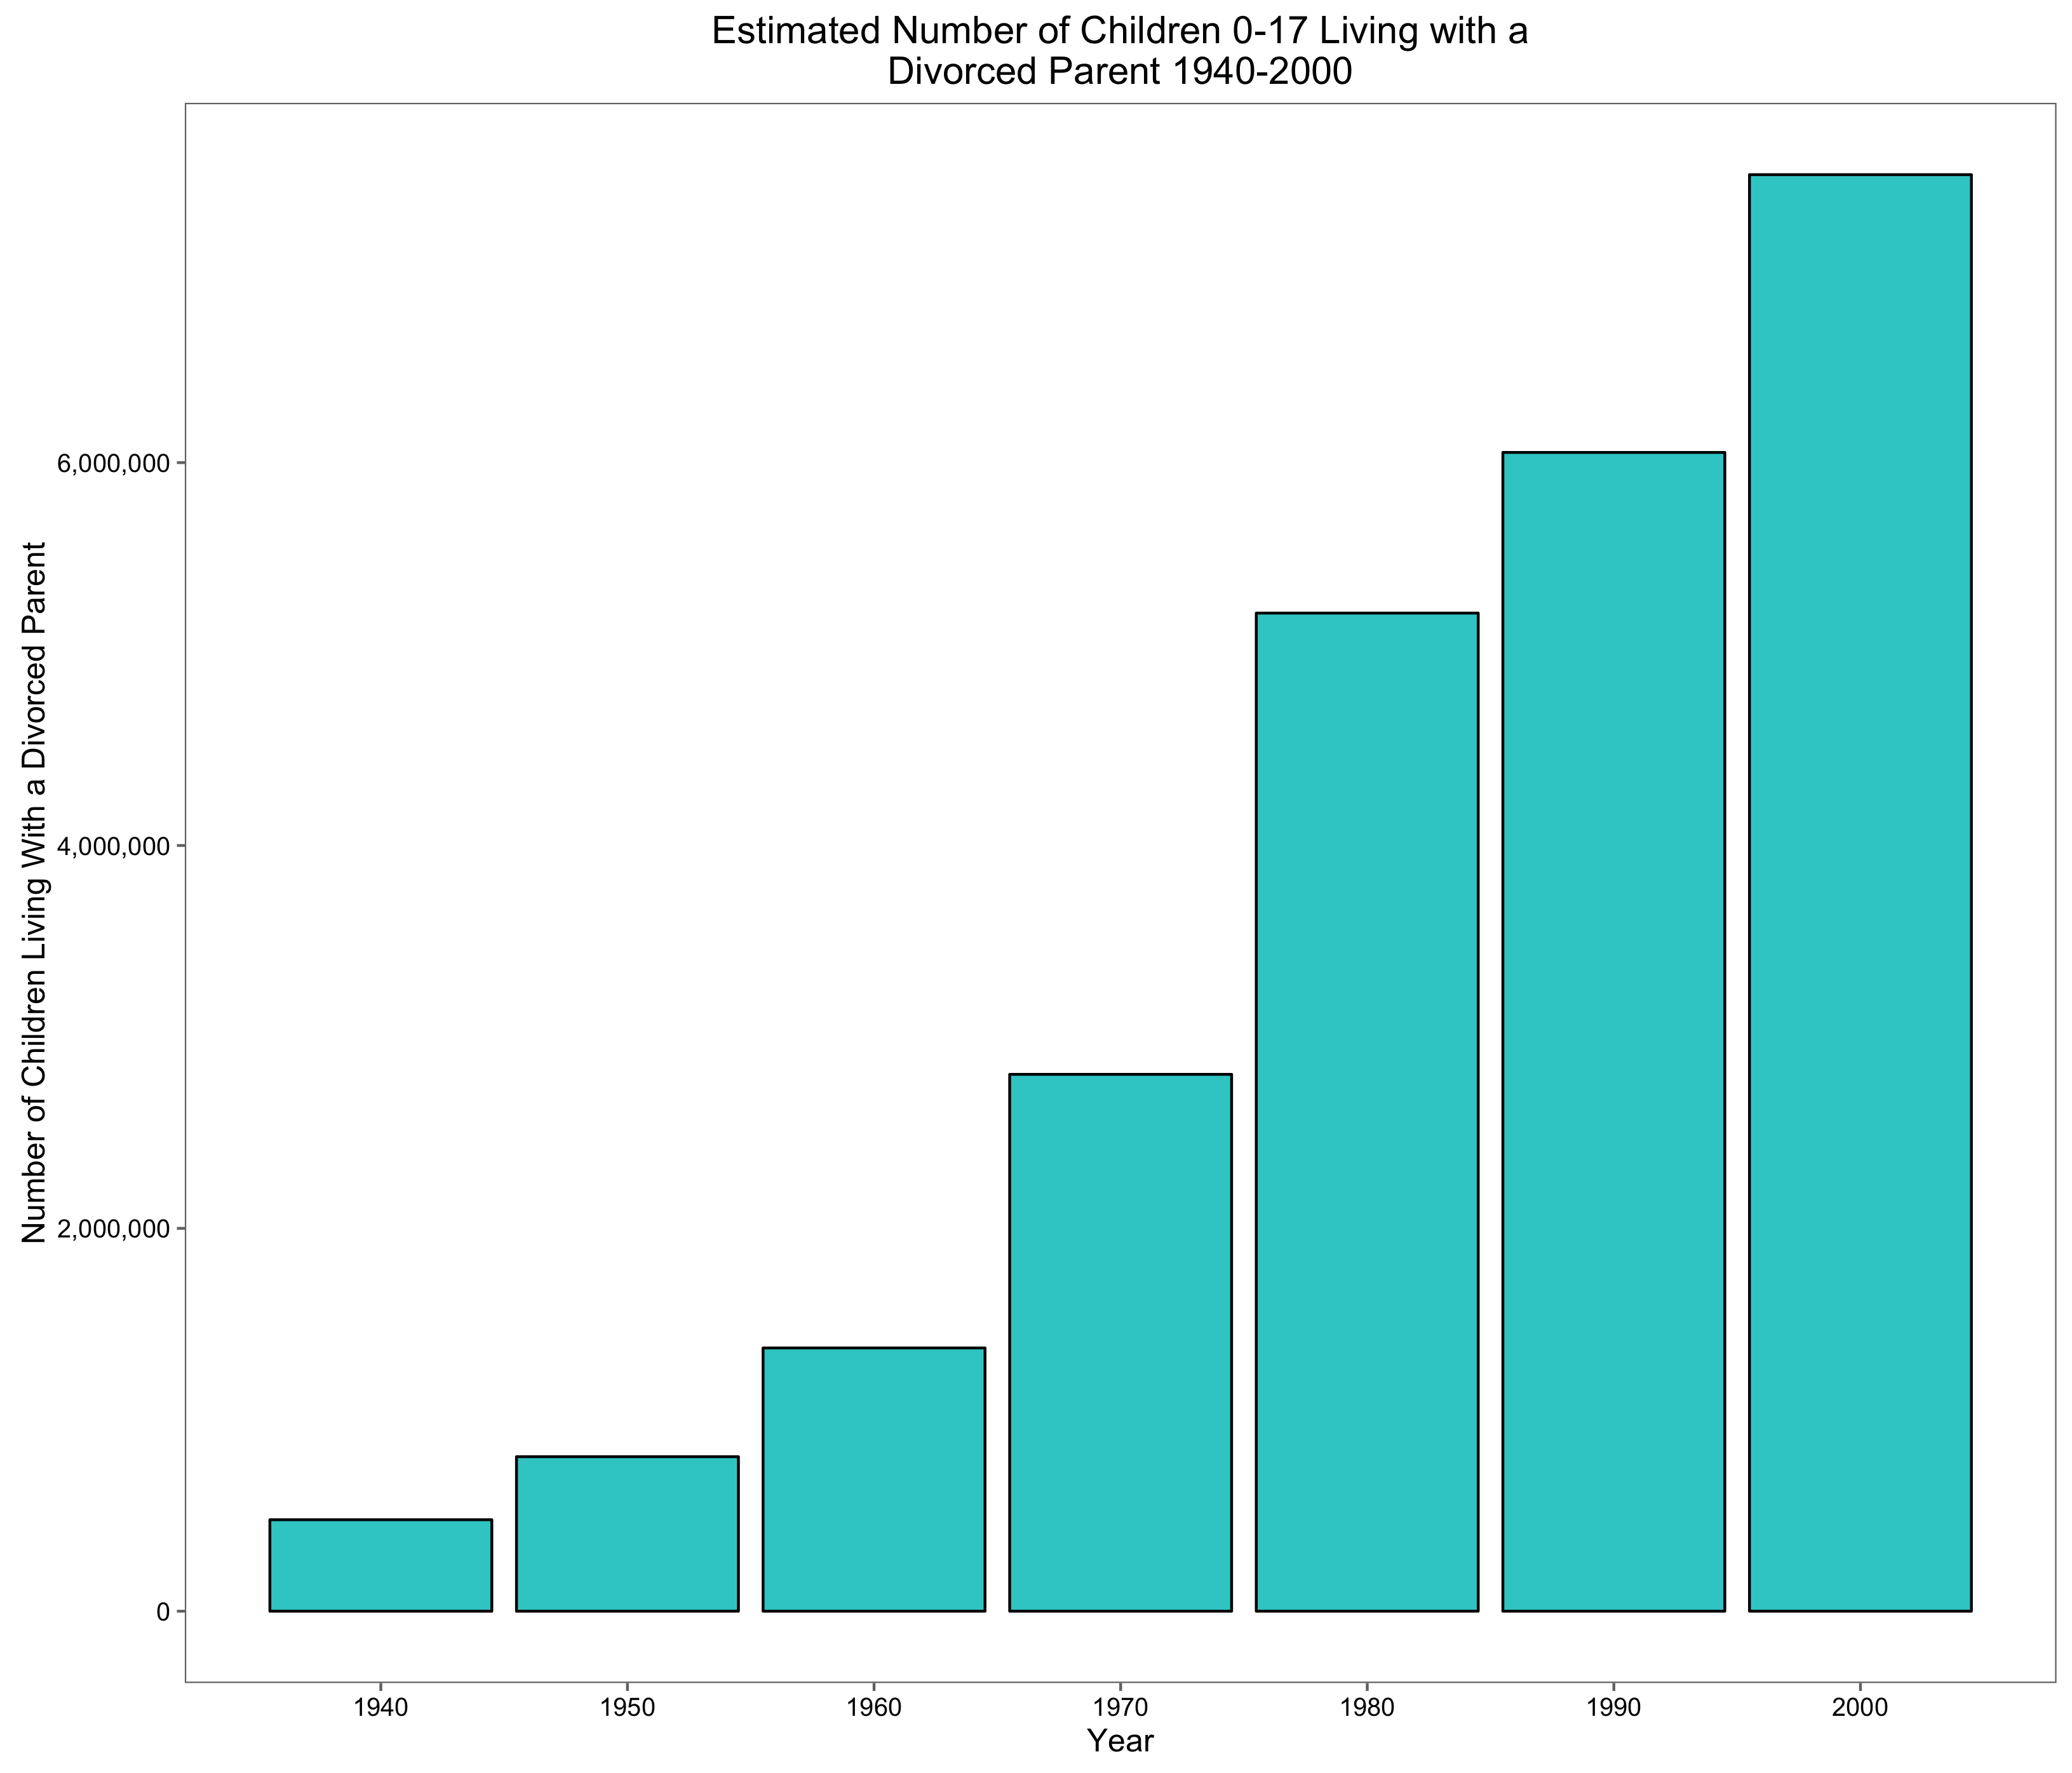
Figure 2:
Figures 3 shows how the number of children living with a divorced parent changes from 1940 to 2000, broken down by age group and race. For both white and non-white children, the number of children living with a divorced parent increases as the child ages. This implies that as more time passes, a couple is more likely to divorce, which makes sense. This also means that during a typical childhood, more children see their parents divorce than remarry. For white children, there is a much larger gap between the age groups. This means that, on average, white parents who divorce tend to divorce when the child is older compared to non-white parents. Non-white parents are more likely to divorce when the child is younger, stay together, or remarry. Steven Ruggles argues that black children are more likely to live in single parent households due to their disadvantaged position in society (Ruggles 1994, 136). This is also likely the case for non-black minority races in the United States. Socioeconomic disadvantages could be what is driving the race differences regarding divorces.
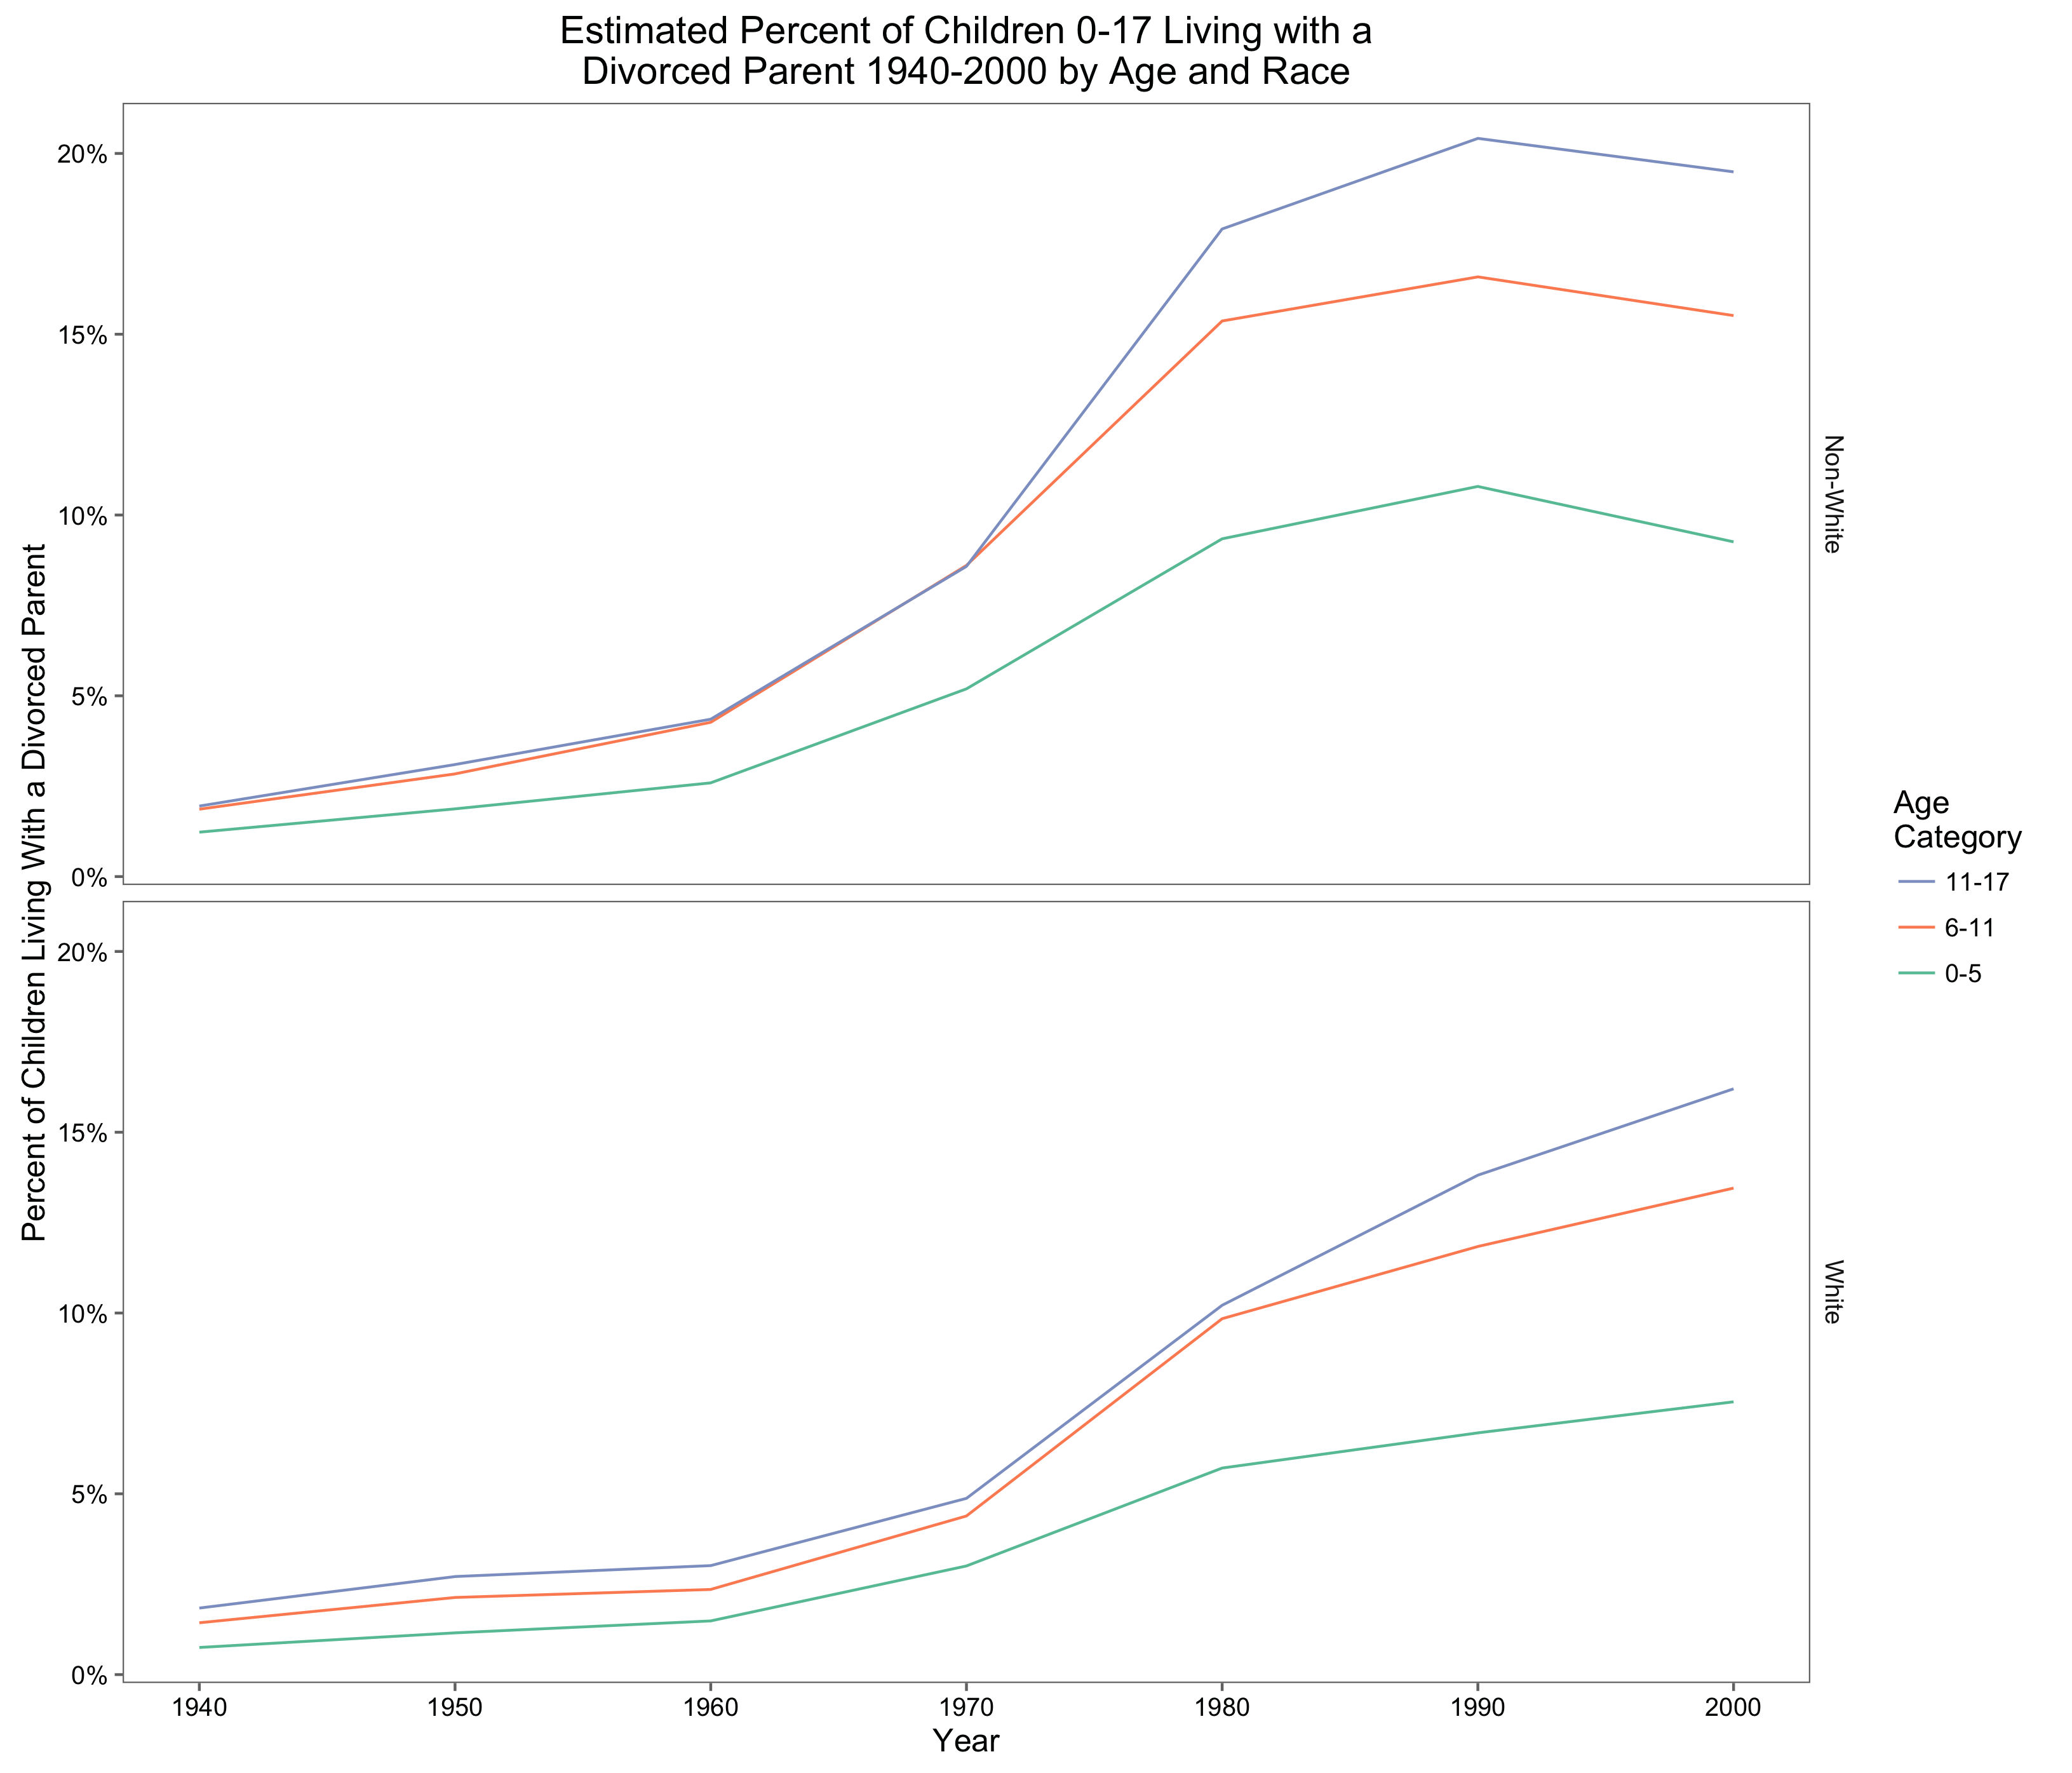
Figures 4 shows how the percent of children living with a divorced parent changes from 1940 to 2000, broken down by age group and race. Most of the trends are the same as Figure 3. Interestingly, however, there has been a decrease in the percent of children living with at least one divorced parent for non-white children between 1990 and 2000, which is the opposite of the general trend in more children living in divorced households. This could suggest that the factors causing non-white couples to divorce have a smaller impact in recent years.
Figure 3:
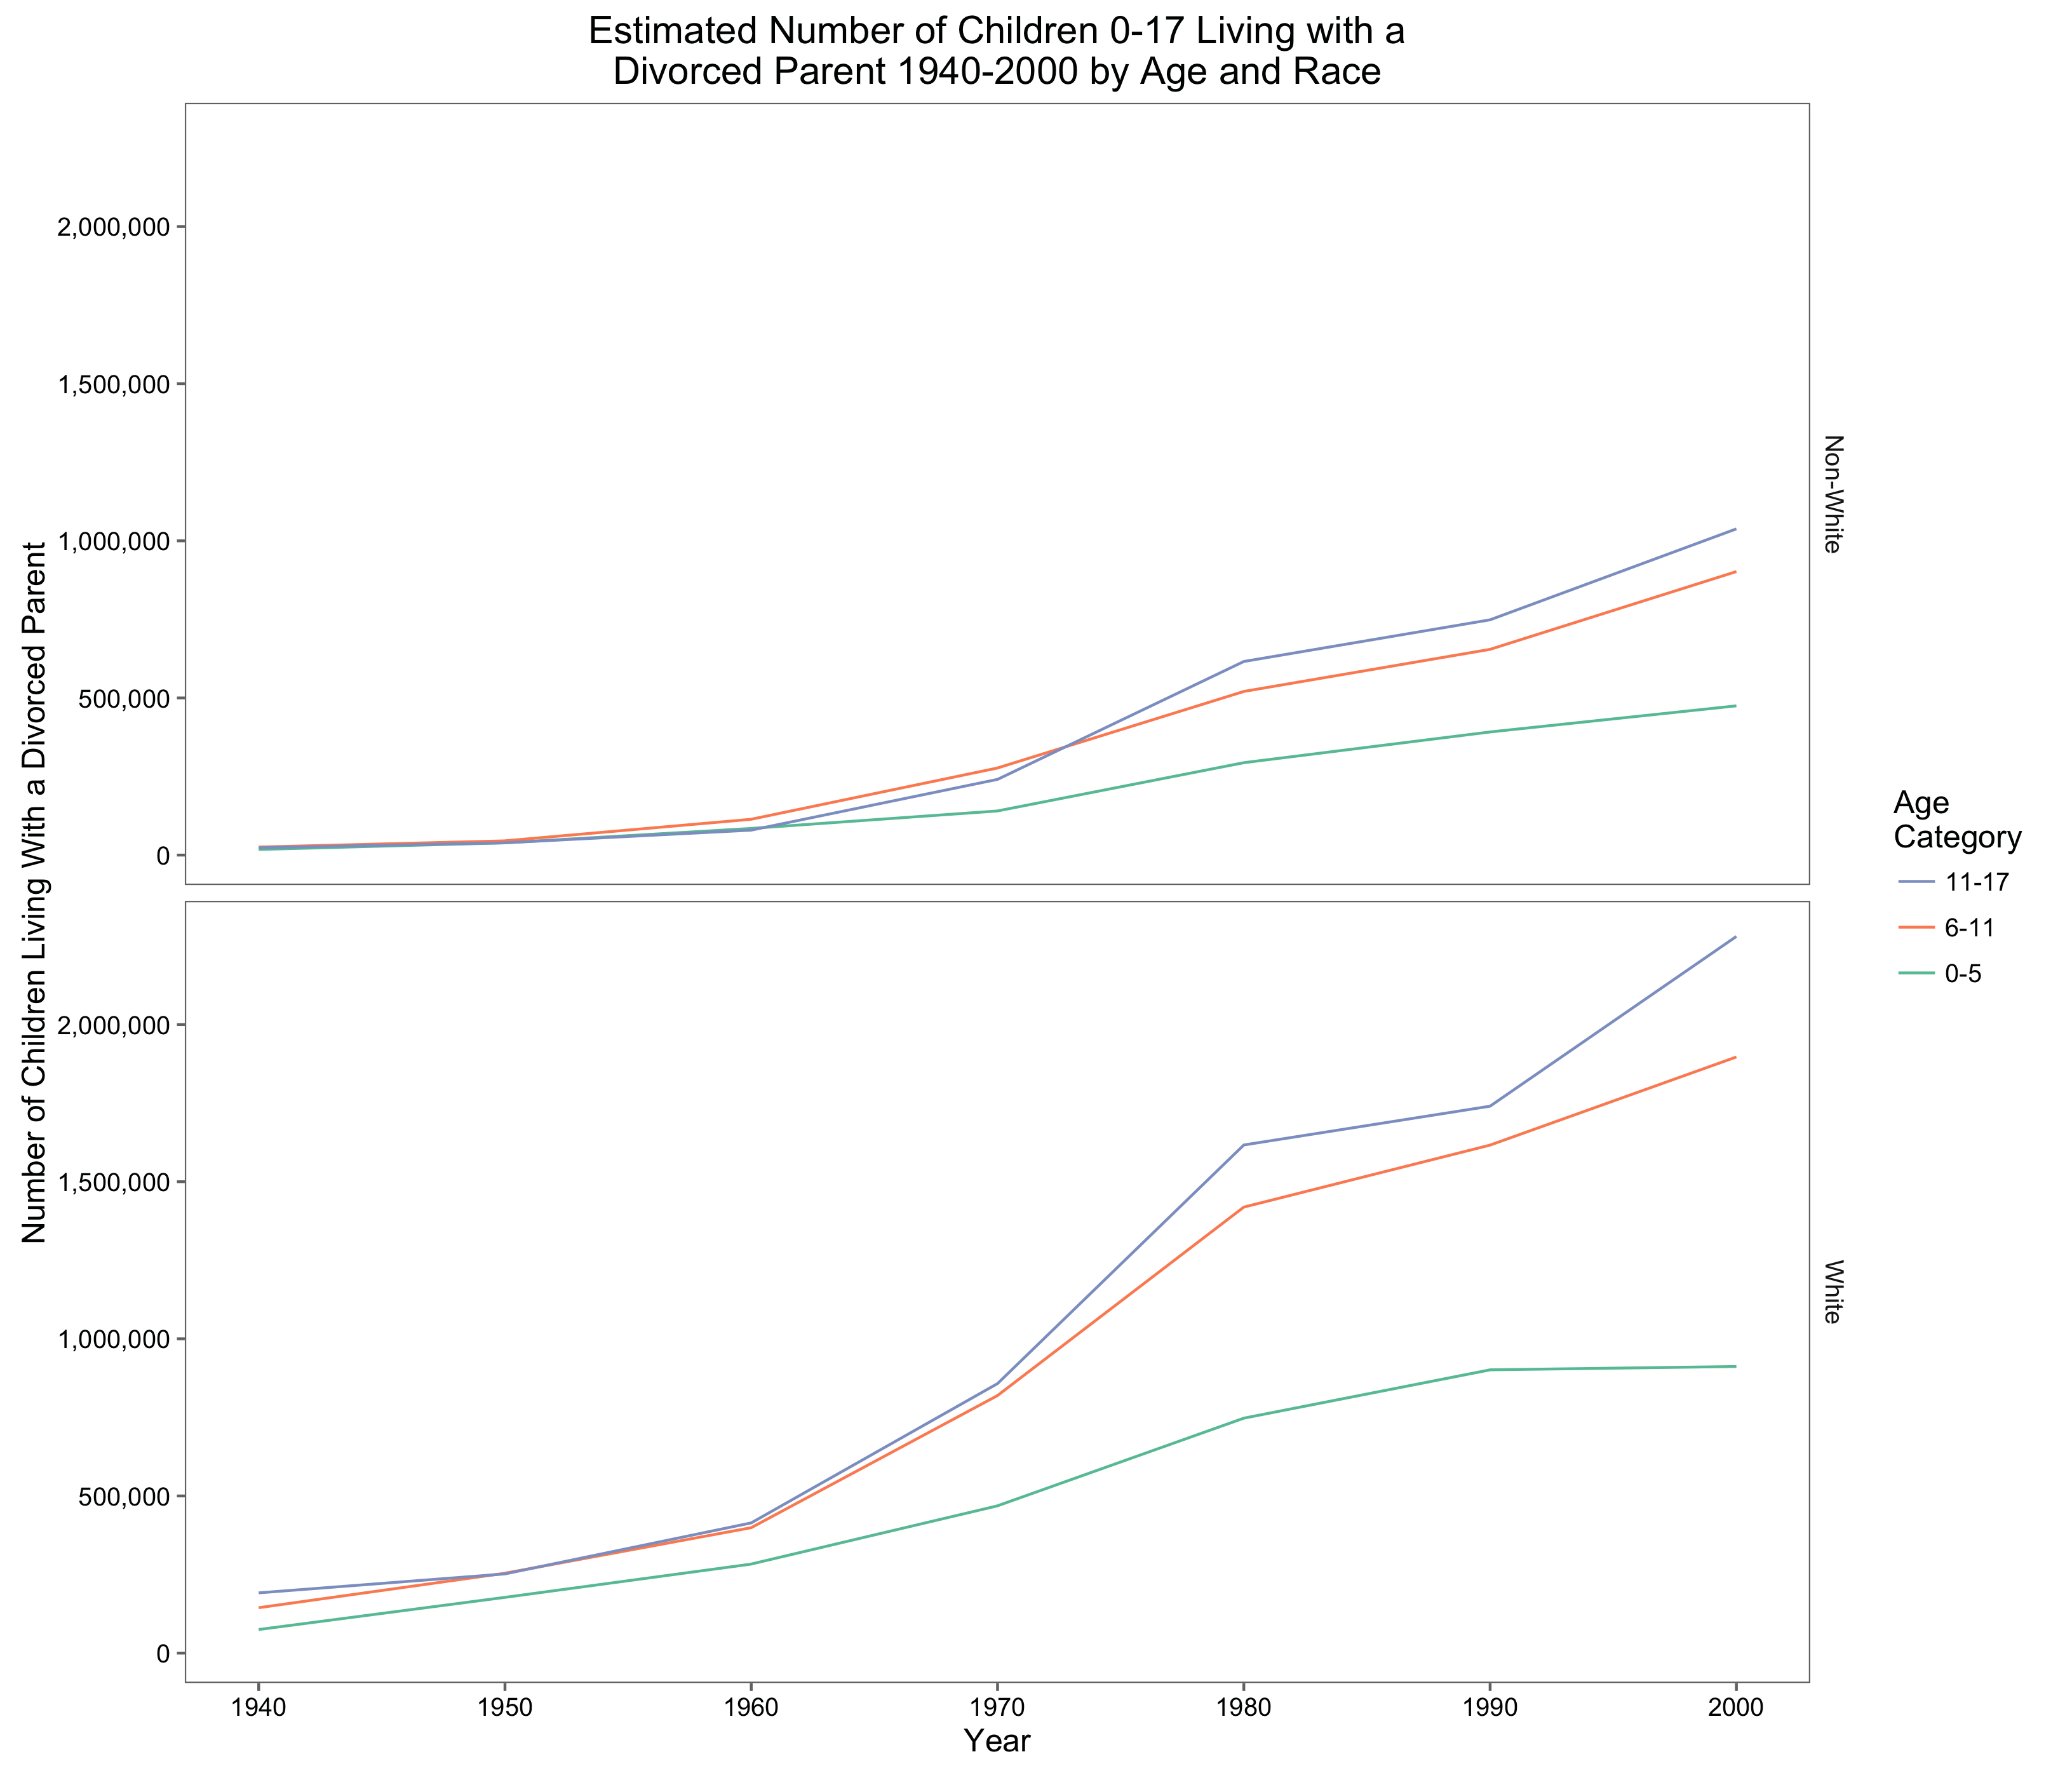
Figure 4:
Conclusion
The decision for a couple to divorce impacts more than the couple. If the husband and wife have children, the entire family is affected by this decision. In this post, I estimated the number of children ages 0 to 17 affected by divorce in the United States between 1940 and 2000. I find that across both white and non-white races, the percent of children who experience divorce in their lifetimes increases over this time period. I attribute this primarily to the social pressure to stay together in the earlier part of this time period. In the 1940s and 1950s, families felt huge pressures to remain together due to the social emphasis on the nuclear family. Over time, however, women have gained more independence, and the pressure to maintain the nuclear families has decreased significantly. Marriage length also increases as life expectancy increases, so the chances of divorcing increases over a longer marriage because there is a much longer time period to stick out an unhealthy relationship. Whatever the reason for an increase in the presence of divorce, I show in this analysis that over time, more and more children are affected by the dissolution of a marriage.
Works Cited
- Hareven, T. K. “The Family as Process: The Historical Study of the Family Cycle.” Journal of Social History 7.3 (1974): 322-29. Web.
- Goldscheider, Frances K., Dennis Hogan, and Regina Bures. “A Century (plus) of Parenthood.” The History of the Family 6.4 (2001): 477-94. Web.
- Ruggles, Steven. “Family Interrelationships.” Historical Methods 28.1 (1995): 52-58. Print.
- Ruggles, Steven. “The Origins of African-American Family Structure.” American Sociological Review 59.1 (1994): 136-48. Web.