

Discrete categorization of race and ethnicity creates a myriad of issues (Omi and Winant 1986, 105). One such challenge, experienced by Americans of mixed heritage, consists of distilling a multi-faceted background into a single dimension for the purposes of the Census (Hochschild 2008, 60). Although the two most recent iterations of the Census have allowed respondents to claim multiple racial identities, respondents in the early twentieth century did not have this option. Moreover America’s problematic history of racial classification, particularly with respect to black Americans (evident Jim Crow laws and other policies tied to the one-drop rule), leaves black-white biracial Census respondents with a particularly unique choice when it comes time to report their racial identities. I use census microdata from the IPUMS-USA project in order to examine how responses to this choice have varied over time and across regions.
Scholarly background
Documenting the racial identity of mixed heritage persons has posed a challenge for the Census Bureau since the first census that collected individual-level data (in 1850). As part of this census, enumerators were required to collect information on an individual’s status as a mulatto (Hochschild 2008, 67). The academic popularity of race science led to the inclusion of quadroon and octoroon categories in the 1890 census (Hochschild 2008, 68), representing lesser degrees of “black blood”. Without any information on an individual’s family history, enumerators were expected to provide the Bureau with their best guess for individuals of suspected mixed ancestry (ibid.)
Data and methods
In order to examine the historical classification of black-white biracial Americans over the course of the 20th century, I turned to the Integrated Public-Use Microdata Series, using census samples from 1920 through 1980. For 1930, I used the 5% sample; for 1970, I used the 1% State Form 1 sample; for 1980, I used the 5% state sample; and for all other years, I used the 1% sample provided by IPUMS.
It should be noted that I did not initially intend to focus on children. Nevertheless, this scope was chosen because it would be not be possible to otherwise determine who is of mixed heritage; the racial identity of a respondent’s parents is never asked by the Census. Insofar as a child’s racial identity later in life is correlated with the race declaration that their parents choose for them, any findings from this investigation will apply to the populace at large.
In order to identify the relevant population, I filtered the data set for non-hispanic black and white children living with a both non-hispanic black or white parents. For the sake of this analysis, the 1920 black classification includes those termed mulatto. This group does not represent a significant portion of the black children or parents analyzed for that year. Beyond year, racial classification as black or white is not broken down into any other subgroups; we are left to largely take these binary variables at face value, caveating with any significant changes in the questionnaire. Although the data set was filtered to only include biological children of the household head, a biological link between a head’s spouse and a head’s child was assumed for the sake of this analysis. Similarly, inconstancy in the use of the ‘partner’ relationship in census responses did not allow me to use that information to infer parentage.
With the appropriate subset of individual responses, it was possible for me to classify children by the race declaration of either implied parent and by a child’s own classification on the census. The subset for which implied parents are of different races is most relevant to my analysis.
Given this subset, other characteristics, such as the region in which a family lives, and a child’s sex or age, allow me to further stratify the data. Indeed, all of the results were generated simply by plotting the summed person weights of various cohorts against the year in which the census was taken. Although the later age and sex stratification did not reveal anything noteworthy, the region in which a biracial child lives appeared to influence the likelihood with which a parent will declare them to be either black or white.
All of the conclusions that follow assume that any physical factors that might play a role in the determination of racial identity, such as skin tone or the number of grandparents a child has of either race, do not change dramatically vary by year for the average biracial child. This allows us to limit discussion of potential explanations to those that are indeed more plausible.
Results
Before drawing any conclusions about biracial children, I might choose to consider the population of children by race category. For the sake of clarity, the reference group consists of the children of same race parents. As is evident in Figure 1, the ratio of white to black children reported does not differ dramatically from year to year. Black children represent 8% to 10% of ‘same race parent’ children, with the slight uptick taking place in 1970 and 1980.
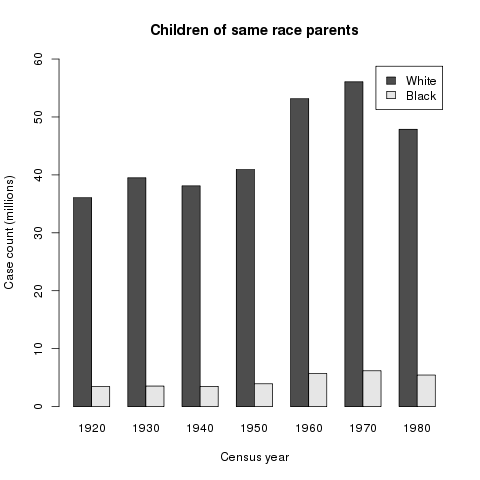
Figure 1.
An analogous chart was generated for the population of children in the biracial cohort (Figure 2). One of the most striking features of this chart is the significant increase in the total number of biracial children in 1940. Given that this classification is generated on the basis of a difference in parental race declaration, it is plausibly the result of an increase in actual (or reported) interracial marriages rather than a change in questionnaire instructions. Alternatively, it may simply reflect an uptick in the number of interracial families that are able to stay together. That is to say, any change in classification methodology probably did not have a different effect on a respondent and his/her spouse; therefore an increase in couples is probably not the result of questionnaire syntax.
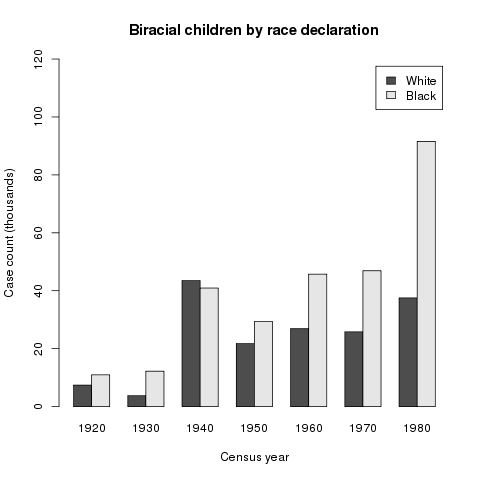
Figure 2.
It is difficult to establish a causal link for this jump, in light of the fact that most state anti-miscegenation laws were not challenged until after WWII. Indeed Loving v. Virginia, which ruled such laws unconstitutional, was not decided until 1967. Moreover the fact that more than half of the children represented in this year lived in the South (Figure 3), undermines the possibility that the uptick is the result of changing social attitudes in areas where interracial relationships were not restricted or frowned upon. Indeed, Figure 3 shows that from 1930 to 1960, a very large proportion of biracial children lived in the South, suggesting that in spite of segregation and other divisive policies, many of America’s biracial children were born to families in this part of the country.
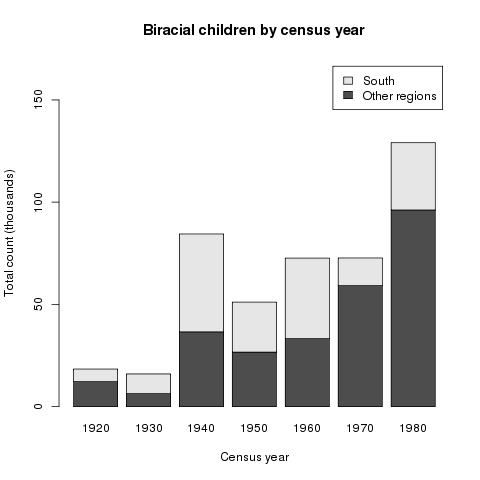
Figure 3.
Taking a look at the racial declaration of these children (Figure 4), I find that about 65% of the time, the child of different race parents would be reported classified as black. The widths of the columns in this figure (and in Figure 5) are proportional to the number of biracial children observed within each respective geography for a given year. There do not appear to be any consistent trends with respect to the population of biracial children nor is there a clear change with respect to the rates of race declaration. One might assume that the method by which enumerators and parents have made this judgement has not changed significantly over time. Turning to Figure 5, I see a start contrast.
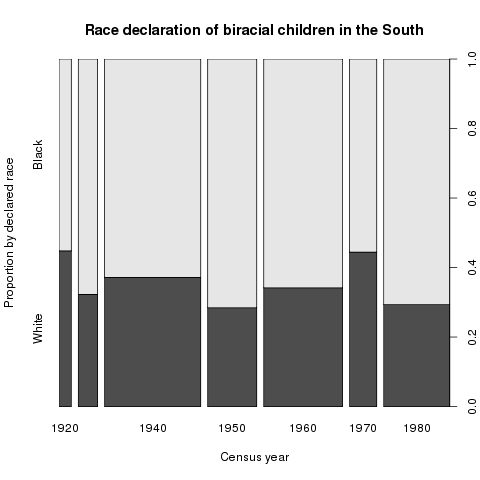
Figure 4.
Figure 5 shows the probability with which the biracial child of a white census household head (typically male) would be declared either black or white for census purposes. It should be noted that the instructions given to enumerators for early census years was to assume that biological children are of the same race as the household head. This instruction (if followed) would suggest an overwhelming probability of being declared white for those years. Conversely, the one drop rule would imply an overwhelming probability of being declared black whenever applied. In reality, neither of these rules can wholly explain the heterogeneity that I see. In 1960 onward, the shift to mail back questionnaires led to
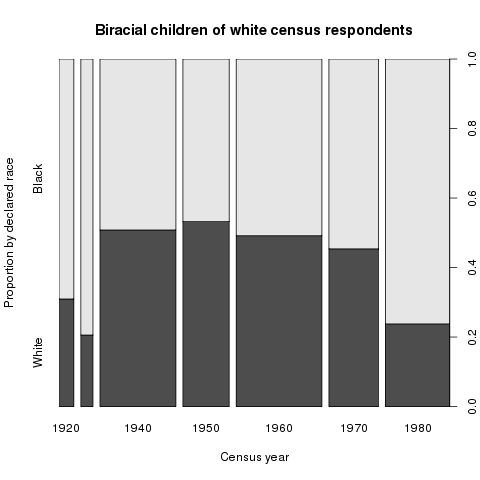
Figure 5.
Through the 1950’s, the probability of being declared white increased, to a peak of ~45% (equivalent to the average probability of being declared white for all years in the South). Since then, this probability has consistently declined, almost halving by 1980. The trend among back census respondents had the same profile and otherwise only differed in being noisier. Again, it is difficult to infer any kind of causality, but the inflection point does appear to roughly coincide with the civil rights movement. Perhaps the perceived benefits of checking one box over the other have declined, or black empowerment has resulted in people viewing their identities (and those of their children) differently. Without more granular data on individual racial identities (i.e. whether or not someone has previously checked a different box) it is not feasible to draw a causal link between the trends I observe and the aforementioned movement.
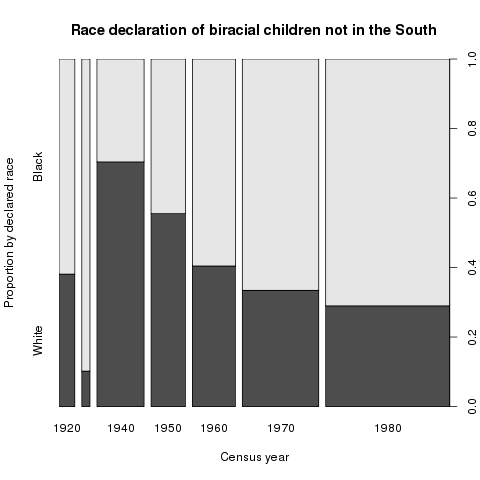
Figure 6.
Addendum: In considering Figures 4 and 5, I decided to take a closer look at the counterpart to Figure 4 for the non-South. Perhaps unsurprisingly, it reflects a similar trend to the one illustrated in Figure 5, but at a more extreme level (that is not tempered by Southern data). It appear to support the notion that same notion that the desirability of the white checkbox has diminished with respect to its counterpart. The mechanisms behind this likely do not differ between America overall and the non-South in specific.
Conclusion
The probability that a biracial child is categorized as black or white is more complicated than a simple coin toss, or than any enumerator instructions would imply. Although children in the South have consistently had a relatively high (and constant) probability of being declared white, the data reveal a national trend in the other direction. As discussed earlier, multiple factors likely bolstered this trend. Changes in enumerator instructions influenced the way biracial children would be classified in the early part of the century. The switch to the mail back census in 1960 and 1970 likely led to more autonomy in how the children of householders were classified by their parents. The direction of this effect was likely dictated by the growing sense of racial identity that grew out of the civil rights movement.
Sources
Hochschild, Jennifer and Brenna Marea Powell. “Racial Reorganization and theUnited States Census 1850–1930: Mulattoes, Half-Breeds, Mixed Parentage, Hindoos, and the Mexican Race”, Studies in American Political Development. 2008; 22(1): 59-96. Print.
Omi, Michael, and Howard Winant. Racial Formation in the United States: From the 1960s to the 1980s. New York: Routledge & Kegan Paul, 1986. Print.
Ruggles, Steven, Katie Genadek, Ronald Goeken, Josiah Grover, and Matthew Sobek. Integrated Public Use Microdata Series: Version 6.0 [Machine-readable database]. Minneapolis: University of Minnesota, 2015.