

Introduction
From its invention in the late 1870s, the telephone has revolutionized the economic and social lives of countless Americans. Today, almost everyone in the United States has access to a telephone, whether in the form of a home phone or personal cell phone. Access to this technology, however, has not always been so widespread. After its invention, the telephone spread from the realms of the government and large corporations to the households of everyday Americans very slowly, only becoming widely adopted in the mid-20th century (Fischer Carroll 1153). The aim of this project is to analyze the distribution of access to telephones between 1960 and 2010. It focuses especially whether or not there existed (or exists) inequality in telephone distribution based on four dimensions of analysis: birthplace, primary language, race, sex, and income. We live in an era in which our lives are defined by technology, access to which can determine how we communicate, the quality of the education and healthcare we receive, and whether or not we are able to succeed in a rapidly evolving economic landscape. This project seeks to shed light on inequality as it relates to the adoption of new technology and access to information, perhaps enabling better understanding of contemporary issues related to the internet and freedom of information.
In order to complete this analysis, I use a combination of ACS and Census data (1% samples for all years). A question related to telephone availability has been part of every Census (long form) and ACS form since 1960, as have questions related to my various demographic dimensions. This project makes liberal use of visualizations, especially faceted bar charts to make comparisons between demographic groups and scatterplots/line graphs to make sense of broader, long-term trends and relationships. It also makes use of regression analysis to study the relationship between two variables: income and race. This analysis makes used of fixed effects for each year of data, hopefully helping clarify the relationships being analyzed.
Available academic literature related to trends in access to and ownership of telephones is quite expansive and surprisingly interdisciplinary. The topic has been studied by scholars from a wide variety of fields, including business, economics, sociology, anthropology, and history. Because my analysis of telephone access and distribution will focus primarily on quantitative measures of inequality in telephone access and ownership, the majority of the literature I chose to focus on is quantitative in nature and focuses on demographics. More specifically, the literature primarily focuses on variation in telephone access and ownership as it relates to race, sex, and age. While the literature available seems to be quite broad in subject matter, many of the studies I found (particularly quantitative ones) were published in the last two decades of the twentieth century, leaving me completely in the dark with regards to the ways distribution of access to and ownership of telephones has changed over time. I hope my project is able to shed some light on that question.
Studies differed dramatically in their conclusions related to racial differences in telephone ownership and access. A study conducted using 1970 census data found the results one might predict when considering racial inequalities in telephone ownership and access: “households with telephones were more likely to have white, male heads of higher average
income, education and age” (Wolfle 421). This result is roughly in line with the most obvious logical explanation for inequality in telephone access. First, it makes sense that income might be related to telephone access because telephones were fairly expensive to install, especially before they became completely ubiquitous. Second, because telephone infrastructure requires significant investment, it is possible primarily African-American communities were passed over when it came time to make these investments, possibly explaining part of the racial disparity in telephone access. More recent studies have found dramatically different results. A 2009 study of low-income individuals living in rural Maryland found “individuals without landline telephones were more likely than those with landline telephones to be white and to have an income of $20000 to <35000” (Shebl et al. 499). The most obvious possible explanation for this difference in result is, of course, the fact that the studies were conducted nearly thirty years apart, with the first study using data nearly forty years older than that of the second study. It seems reasonable to assume that by 2009 cell phones were well on their way to replacing landline telephones in most American homes, perhaps preferred over their household counterparts. The results of the second study also suggest that geography is likely worth taking into consideration or at least including as a possible control.
Much of the literature regarding telephone distribution and access also considers sex as a factor worth considering. One such study, published in 1981 by Bell laboratories, found that women tended to use phones more extensively than men. Although this study isn’t directly related to household telephone access or ownership, disparities in use might certainly be worthwhile to consider in my analysis. Conversely, another study (the Wolfle study cited earlier) found that households with telephones were more likely to be headed my men, while a third (the Shebl study) found no significant difference in access and ownership between men and women. Unlike these studies, my paper analyzes whether these disparities persist over time and whether they might be related to other variables.
While the literature on the topic of telephone ownership and access distribution is quite extensive, I believe my broader analysis of the topic adds significant value. I hope that my project is able to shed some light on the subject from a broader, more data-driven perspective.
Methods
The analysis conducted in this project makes use of the following ipums datasets:
1960 1%, 1970 met1%, 1980 metro1%, 1990 1%, 2000 1%, and the 2010 ACS. My primary analysis will make use of the variables PHONE (whether or not a household has access to a phone), BPL (birthplace), RACE (race), RELATE (relationship to head of household used to identify household heads), SPEAKENG (whether or not an individual speaks English), and SEX (whether a household head is male or female). My secondary analysis will also include CPI99 (income multiplier based on the 1999 Consumer Price Index), FTOTINC (total family income), and AGE (an individual’s age). For all income-related analysis I calculate income using CPI99 to ensure incomes are standardized for reasonable comparison. In my linguistic analysis I divide those who speak no English or describe themselves as speaking English “not well” from those who claim to be native speakers or speak English “well” in order to create my two categories. My racial analyses exclude a Hispanic category due to the dramatic changes in its use and definition over the course of the last half-century. I also aggregate every Asian census category (Vietnamese, Japanese, Chinese, etc.) into a single “Asian” category. All variables are at the household level (code: https://gist.github.com/jocrug/dbb3e0837f7801be9dd972ae7755338e)
This paper’s primary analysis focuses on the relationships between various demographic characteristics and the availability of telephones. Central to this analysis are visualizations. I make use of faceted bar charts to highlight inequalities in telephone distribution over time. These charts facilitate qualitative comparisons between individuals with the various characteristics included in my analysis. I have created one set of faceted bar charts for each dimension of analysis I include, faceting by year to facilitate comparisons in inequality over time. Line graphs and histograms are also used to highlight income inequality and illustrate the relationship between income and average access to telephone use amongst various cohorts. Furthermore, this project’s secondary analysis makes use of more rigorous statistical methods, developing and visualizing multivariate regression models for the spread of telephone availability in the latter half of the twentieth century.
For my secondary analysis I converted several race and demographic variables into dummies for use in regression. I then exported the resulting dataset into STATA, a popular statistical software tool used for a wide variety of social science analysis. I conduct two types of statistical analysis of this data; first, I created a linear regression model of the effect of race and income on household phone access that included year fixed effects and duplicated observations based on weight. While linear models can be used for the analysis of dummy dependent variables, they often fail to fit the data as well as a non-linear model might (Von Hippel). Thus, I also attempted to analyze the data using logistic regression, again weighting by duplicating observations and using fixed effects. However, I was not able to complete this analysis due to apparent computational constraints.
Results
These plots reflect the trends I expected to see based on my review of literature on the topic. Many of the older papers I covered generally found that “households with telephones were more likely to have white, male heads of higher average income, education, and wage” (Wolfle 421). The plots I created observing different trends in telephone ownership by race and sex clearly reflect this disparity, particularly further in the past. Especially notable are the racial disparities in home telephone access, particularly those between Native American and White-headed households. These plots suggest racial and sex-related disparities in telephone ownership decrease as time goes by, consistent with the findings of the newer literature on the topic, such as the Shebl et al. I was unable to find previous literature on my two other dimensions of analysis, English fluency and birthplace. The trends, however, match what one would logically expect.

My analysis of race and telephone access (fig. 1) focused on disparities between white-headed households and households headed by Native Americans and black Americans, two groups subjected to extreme discrimination throughout the 19th century. The results line up approximately with my expectations; between 1960 and 1990, white-headed households enjoyed significantly greater telephone access than their black and Native American counterparts. This disparity persisted to a much lesser degree after 1990 as telephones became more or less ubiquitous. Although the literature doesn’t offer a possible explanation for this phenomenon, it can likely be attributed to one of two possible causes. The first is related to income. Based on an analysis of IPUMS census data, the average incomes of households headed by black Americans and Native Americans are significantly lower than those of white Americans (fig. 2), perhaps negatively impacting their ability to invest in telephone installation.
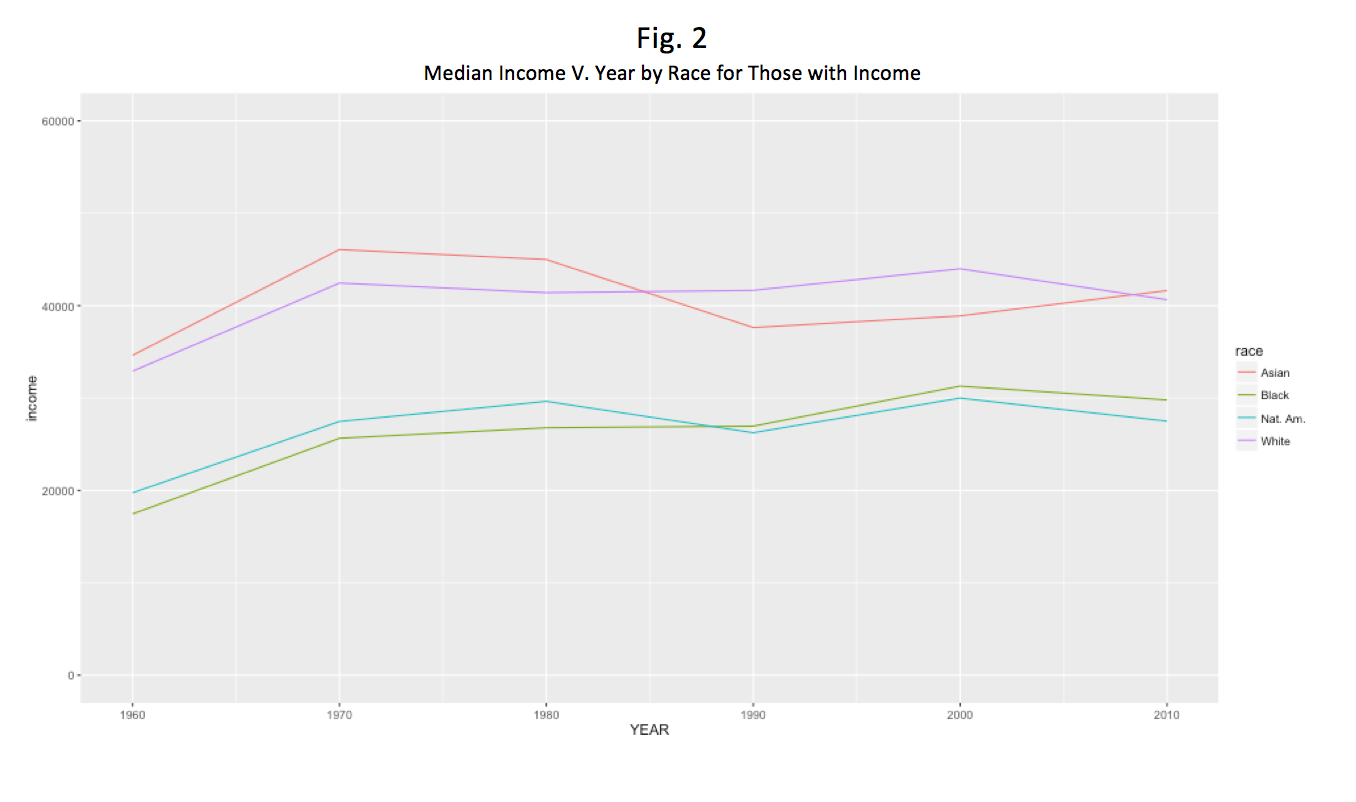
Alternatively, the racial disparity in telephone access could have resulted from differences in the concentration of telephone-related infrastructure between 1960 and 1990. For example, the disproportionate number of Native Americans living in rural areas like reservations could have restricted their access to telecomm infrastructure situated in more urban areas. Similarly, because telephone infrastructure requires significant investment, it is possible governments and corporations discriminated against poorer African-American communities when choosing where to build, further contributing to inequality in household telephone access between black and white Americans. As is reflected in fig. 1, these inequalities decrease as time passes. This decrease in inequality may be a result of decreases in income inequality over the course of the latter half of the twentieth century (fig. 2), paired with decreases in the price of telephone infrastructure and equipment as the technology becomes more widespread. Alternatively, this fall in inequality could possibly be attributed to the decrease in the level of segregation over the course of the last half-century.
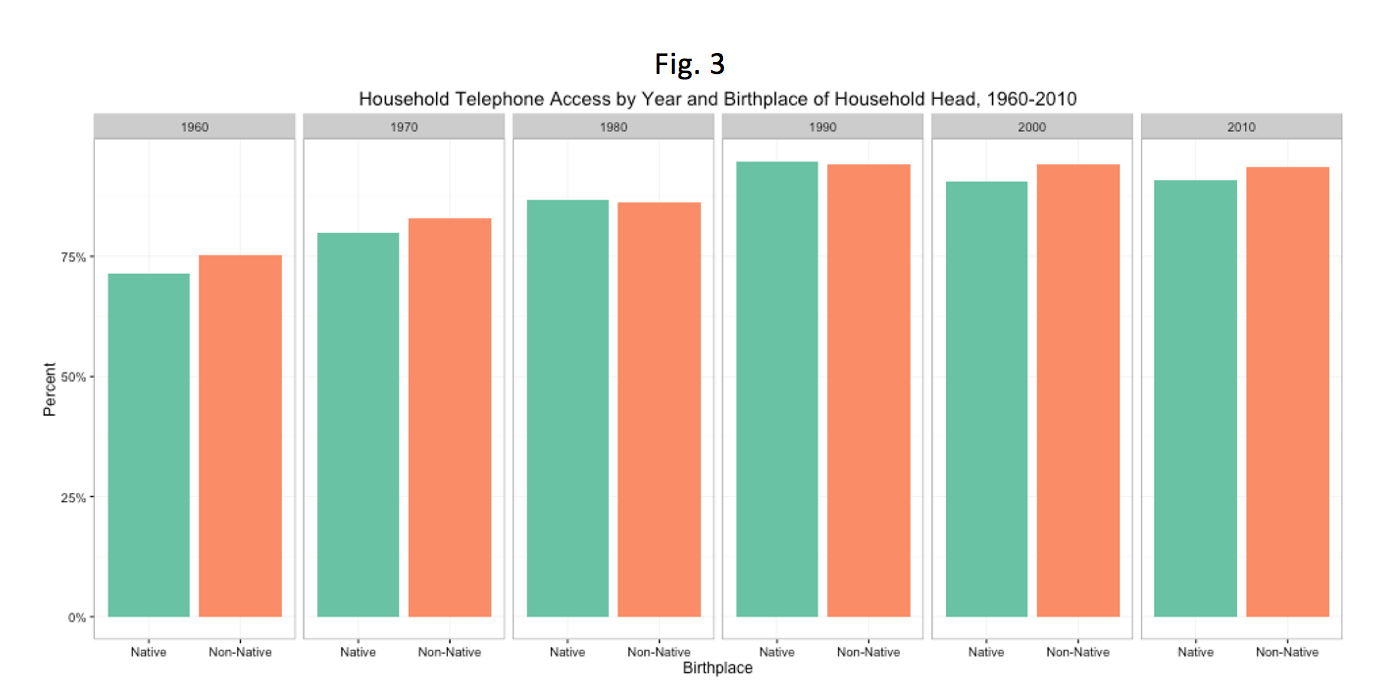
My analysis of birthplace and telephone access focused on disparities (fig. 3) in telephone access between households headed by foreign-born individuals and households headed by native-born individuals. This analysis suggests only a very small (if any) disparity in household telephone access between these two cohorts, with native-born Americans enjoying a slight access advantage over immigrants in the 60s and 70s but immigrants overtaking them slightly every later year but 2000. There are a variety of possible explanations for these trends. The most intuitive possible explanation for this trend is demographic: between 1960 and 2000, immigrants were more likely to live in central cities than their native-born counterparts, possibly allowing them to take advantage of more established technological infrastructure (Boustan et al 133). This inequality may have evened out as telephones became almost ubiquitous even in rural areas.

My analysis of telephone access by whether or not a household head is fluent in English (fig. 4) similarly found much smaller disparities than my race-based analysis. This plot suggests fluent speakers enjoyed slightly more access to household telephones in 1980 and 1990, but that this disparity practically disappeared starting in 2000. There are a variety of possible explanations for the disparity that existed earlier on. The first possible explanation is income-related; perhaps those without the ability to speak English (and thus less able to participate in the economy) were less likely to be able to invest in expensive telephone equipment and installation. Because household heads not fluent in English were more likely to have lower household incomes, it is possible they had less to invest in telephone installation before the technology became completely ubiquitous (and cheaper), accounting for the disparity that existed before 1990. Alternative explanations could include systematic geographic and demand-related differences between fluent and non-fluent English speakers.
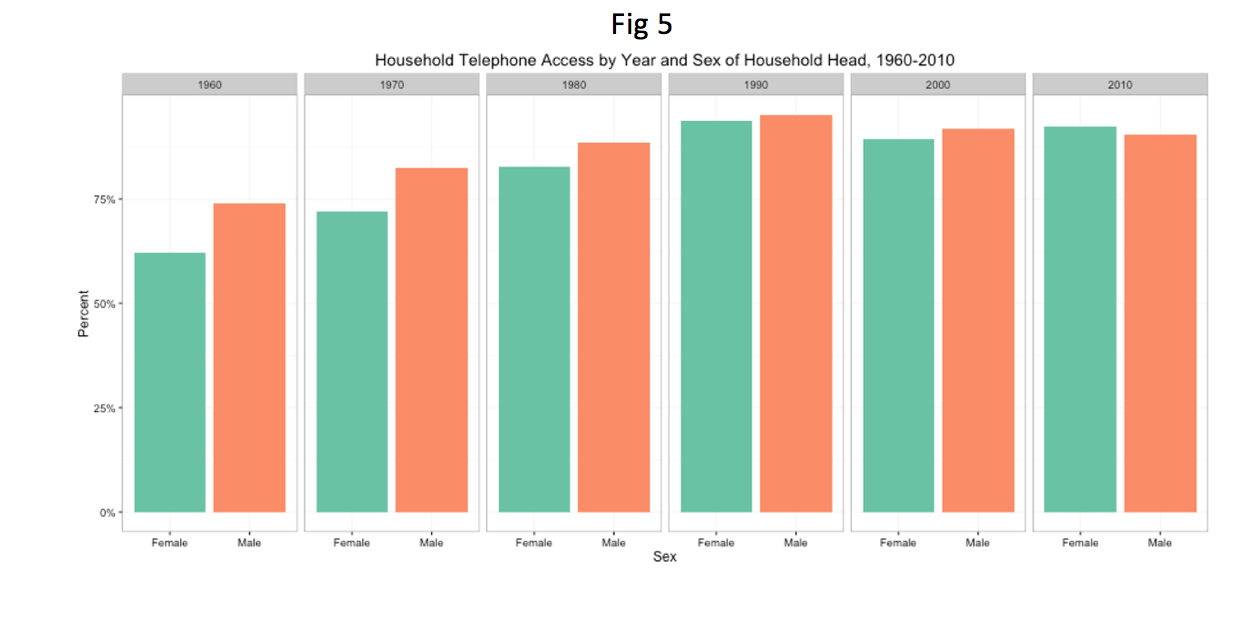
My analysis of household head sex and telephone access (fig. 5) found that households headed by women were far less likely to have access to a household telephone than their male-headed counterparts. This disparity, like the ones described above, can also easily be attributed to income disparities. Women leading households, especially during the mid-twentieth century, were more likely to be, young, employed and, part of low-income households than their male counterparts. Interestingly, this disparity decreases each decade until 2010, when female-headed households outstrip their male counterparts in telephone access. This reversal is possibly related to the dramatic rise in the popularity of cell phones during the first decade of the twentieth century, which may have decreased demand for household (read: landline) telephones.

I chose to take a different approach to my analysis of income and household telephone access (fig. 6). Because income is a continuous measure, I chose to create a scatterplot instead of a faceted bar graph to fully capture the relationship. Instead of arbitrarily designating income categories, I chose to analyze the relationship between income and telephone access through the lens of race, a demographic characteristic intimately tied to income (fig. 2). This race-income plot clearly seems to illustrate a positive relationship between a race-year cohort’s average income and the percent of its members with access to household telephones, suggesting income might at least partially explain racial inequality in telephone access. This analysis, however is far from complete. My secondary analysis seeks to untangle this relationship between income and race by making use of a modified ipums dataset and mathematical regression analysis. The two regression outputs below (tables 1 and 2) summarize the two linear models developed to describe the relationship between household phone access and race.
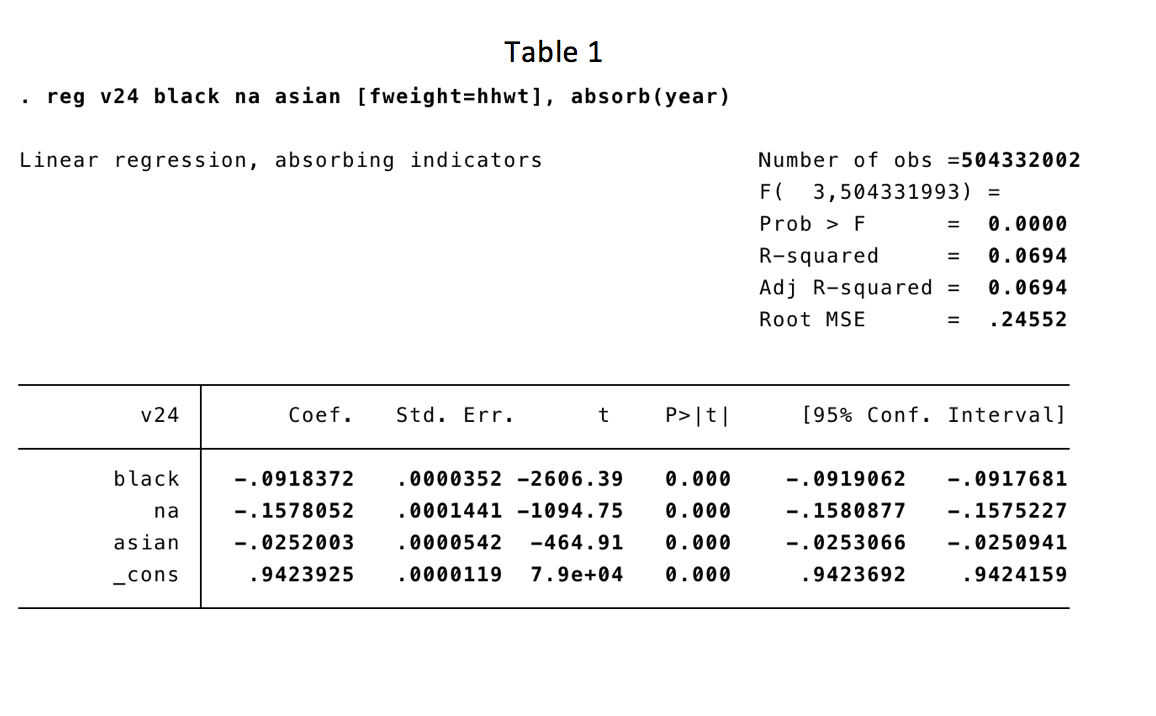

These models suggest significant relationships between race and an individual’s likelihood of owning a phone (v24) that remain approximately in line with the disparities observed in fig. 1 even when income is controlled for (table 2), suggesting other factors may be at play. The extremely weak fit of these models, however, suggests linear regression fails to fully capture the relationship.
Conclusion
This analysis found inequalities in household telephone access and distribution over several demographic, racial, and linguistic groups. It builds on previous literature by analyzing these trends as they change over time, generally finding that these disparities decreased dramatically as telephones became completely ubiquitous in the twenty-first century. It also illustrated reversals in some of these trends in 2010, potentially associated with demand-side effects related to the rise in the popularity of cellular phones. This analysis is valuable because it may help shed light on how the adoption of technologies relates to inequality, something that is important to understand as our rate of technological progress increases due to the enormous impact technology has on health, education, economic outcomes, and communication. Although inequality in telephone access may not be directly analogous to inequality in modern technology like access to high speed internet, the examples of the past may still be valuable to the policymakers of today when it comes to ensuring all their citizens benefit equally from investments in technology and infrastructure. To build on this study, I would seek to further understand how the various possible causes of inequality analyzed here interact, possibly through more advanced statistical analysis. I would also seek to better understand these trends as they change over time in an effort to understand what happens to inequality in access to specific technologies over time as those technologies are replaced. Finally, I would also seek to analyze similar trends as they relate to other types of technology, especially access to the internet.
Sources Cited:
Boustan, Leah, and Allison Shertzer. “Population Trends as a Counterweight to Central City Decline, 1950-2000.” Demography 50.1 (2013): 125-47. ProQuest.Web. 16 Nov. 2016.
Brandon, Belinda B. The Effect of the Demographics of Individual Households on Their Telephone Usage. Cambridge, Mass: Ballinger Pub. Co, 1981. Print.
Fischer, Claude S., and Carroll Glenn R. “Telephone and Automobile Diffusion in the United States, 1902-1937.” American Journal of Sociology 93.5 (1988): 1153-178. Web.
Ruggles, Steven, Katie Genadek, and Ronald Goeken, Josiah Grover, and Matthew Sobek. Integrated Public Use Microdata Series: Version 6.0 [Machine-readable database]. Minneapolis: University of Minnesota, 2015.
Shebl, Fatma et al. “Measuring Health Behaviors and Landline Telephones: Potential Coverage Bias in a Low-Income, Rural Population.” Public Health Reports (1974-), vol. 124, no. 4, 2009, pp. 495–502. www.jstor.org/stable/25682264.
Von Hippel, Paul. “Linear vs. Logistic Probability Models: Which Is Better, and When? | Statistical Horizons.” Statistical Horizons. Statistical Horizons, 5 July 2015. Web. 13 Nov. 2016.
Wolfle, Lee M. “Characteristics of Persons with and without Home Telephones.” Journal of Marketing Research 16.3 (1979): 421-25. Web.