

Introduction:
Question: From 1940-2000, how did women’s involvement in higher education shift, and what influenced it?
Women’s participation in higher education increased in the 1960s and 1970s. Why? What factors influenced this trend from 1940 to 2000 and beyond? Starting in 1979, more women have been enrolled in higher education than men in the United States (Touchton, 50). In 2014, 30.2% of women had a bachelor’s degree, compared to 29.9% of men (Feeney). Women’s participation in higher education has been and continues to be influenced by many factors, including race, social norms, and marriage status.
The Civil Rights Movement in the United States fueled the feminist movement as well. Women demanded equal rights in education on the basis that equality for all in education and under the law should include women of all races as well, not just men of all races. Like the fight against systemic racism, the fight against sexism, especially in higher education and the workplace, remains a difficult battle because the idea of the women’s role in the home and as a caretaker was deeply ingrained in United States society. The 1940s and 1950s marked periods of decreased female employment, due to the post-War economic boom and return of men home from war. However, starting in earnest in the 1950s, the “emphasis on homemaking as women’s primary role was slowly destabilized by a shift in private preferences toward a greater emphasis on careers” (Jones, 282). Teaching, a profession popular amongst women, was a good gateway for women entering other fields because it helped open people to the idea of women with careers.
The distinction between careers and jobs is an important distinction to make in understanding the increase in women’s higher education in the United States in the second half of the 20th century. Having career aspirations was a relatively new concept for women. Previously, men attended college in the hopes of pursuing a career, and therefore throughout the 1960s and 1970s, “the enrollment of men remained relatively constant” (Touchton, 50). Women were expected to remain in the home and raise children, which was work, but not a career. Jobs are temporary and do not have a distinct future, but a career is a path in which individuals build on their experiences to create a holistic story: “a job has limits… a career, in contrast, requires commitment of energy and spirit” (Jones, 251). In addition, an increase in divorce and an overall decrease in the rate of marriage compelled women to seek self-sufficiency. A college education provides a higher probability of an economically stable future and occupation. This trend toward higher education to generate a dependent future income and occupation, specifically for White women, mirrored the pre-existing pressures on minority women to secure an occupation and income.
Due to discrimination, women of different races could not rely solely on husband’s income to support a family as was a trend for the large portion of White families in the 1940s through the 1970s. Jones states, “you were not going to raise a family on one Black man’s salary” (Jones, 256). For example, “90% of Black college and university women” in 1955 were attending higher education to prepare for an occupation (Jones, 250). The same could not be said of many White women overall, with whom it was frequently a goal to meet a husband through college or before college. Britney Nicole Gilmore’s piece also investigates the role of race and culture in educational attainment in “Hispanic Women’s Higher Education Experiences.” She investigates the hypothesis that Hispanic culture specifically influences Hispanic women and their decision making process when considering higher education. She argues that Hispanic women’s lower participation rate in higher education was not only a result of discrimination. She argues, “the belief to be more involved in family possibly becomes overwhelming for Hispanic women,” contributing to lower percentages of Hispanic women earning college degrees compared to other race groups (Gilmore, 9).
My research has revealed many deeper causes of increased higher education in women, varying distinctly by race. Although it is true that the social norms of marriage had a large impact on women’s participation in higher education in the United States in the second half of the 20th century, many other factors were highly influential as well. Race and occupational aspirations impacted the growing trend seen in women’s higher education. Social norms opened the floodgates to women pursuing college degrees in the 1960s and 1970s.
Data and Methods:
The data for all figures are from the census data available on IPUMS, the Integrated Public-Use Microdata Series. It was extracted from IPUMS 1% samples for the years 1940-2000 in the United States; however, for the year 1970 the 1% State Form was used, and for 1980, the 1% Metro Form was used. Women under the age of 22 were filtered out to isolate the college-aged and possible college-graduate population of females.
Figure 1 is a line graph that visualizes the percent of women with a college degree by race. Using the EDUCD variable, anyone with 4 years of college or more is considered as having a degree, and anyone with less than 4 years of college is considered as not having a degree. ‘Married’ denotes any woman ever married, and ‘Unmarried’ denotes any woman never married. Because race and ethnicity are separate variables, I used the HISPAN and RACESING variables to identify if someone was Hispanic and if not to use the single race variable to place them into an IPUMS race category. The race categories are Hispanic, White, Black, Native American, Asian, and Other. The ‘Other’ category was filtered out due to inconsistency. Code for this visualization available on GitHub.
Figure 2 shows a bar graph of the marriage rate by race for women. I again used the HISPAN and RACESING variables to create race categories. The race categories are Hispanic, White, Black, Native American, Asian, and Other with the ‘Other’ category filtered out due to inconsistency. The same qualifications for the ‘Married’ and ‘Unmarried’ as well as the ‘Degree’ and ‘No Degree’ as Figure 1 categories were used. Code for this visualization available on GitHub.
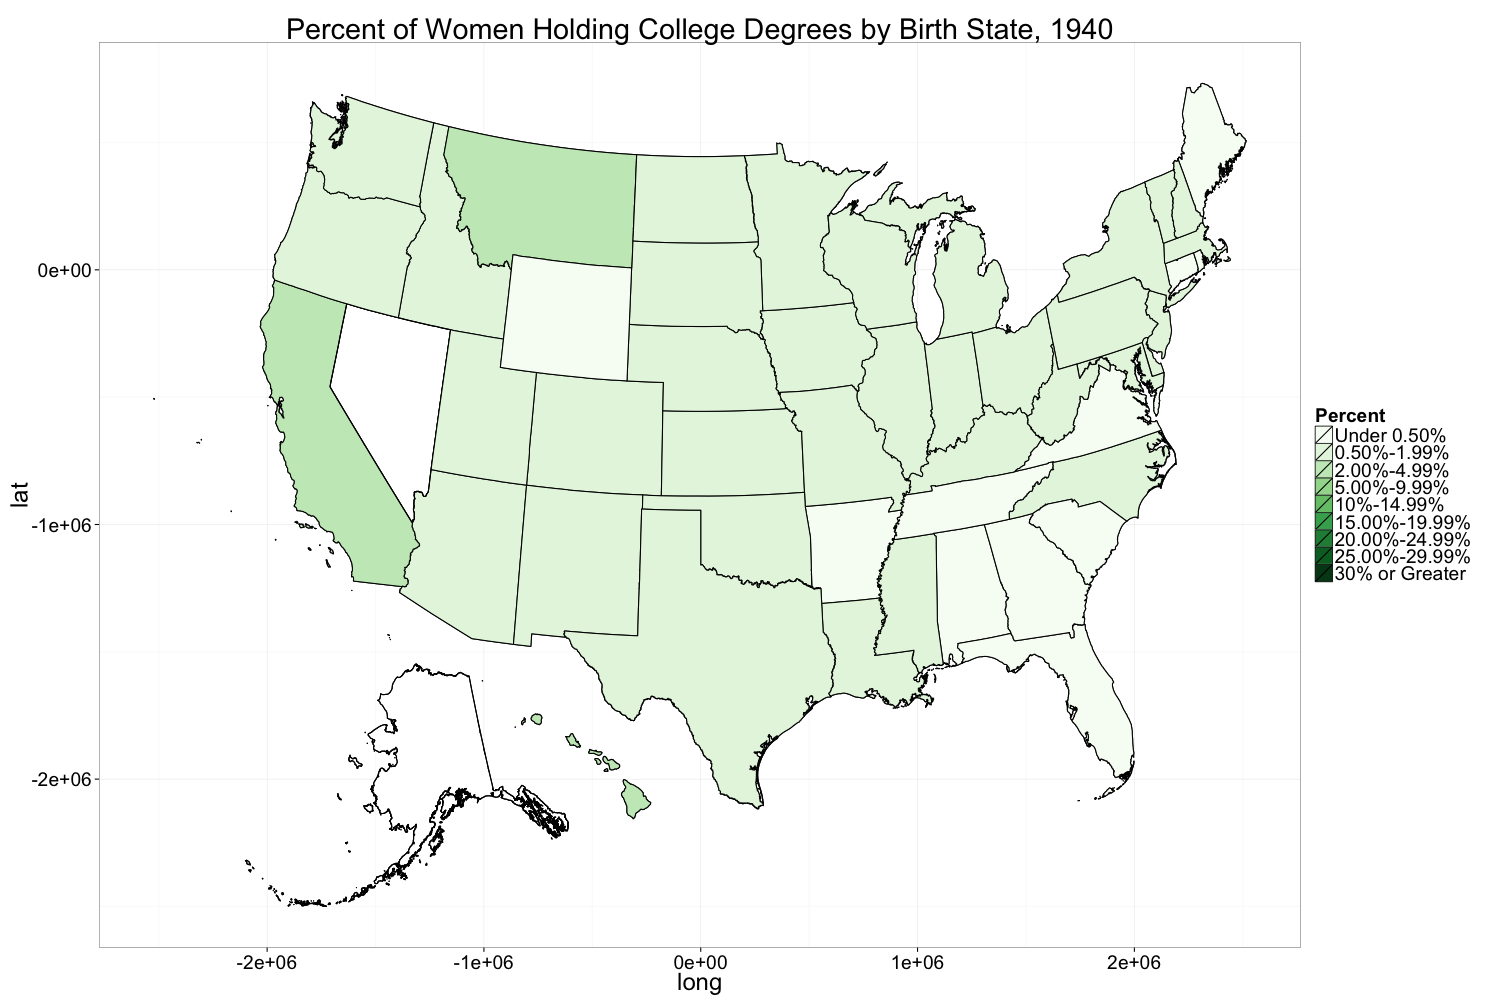
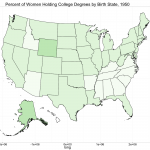
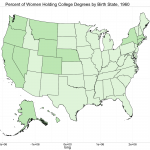
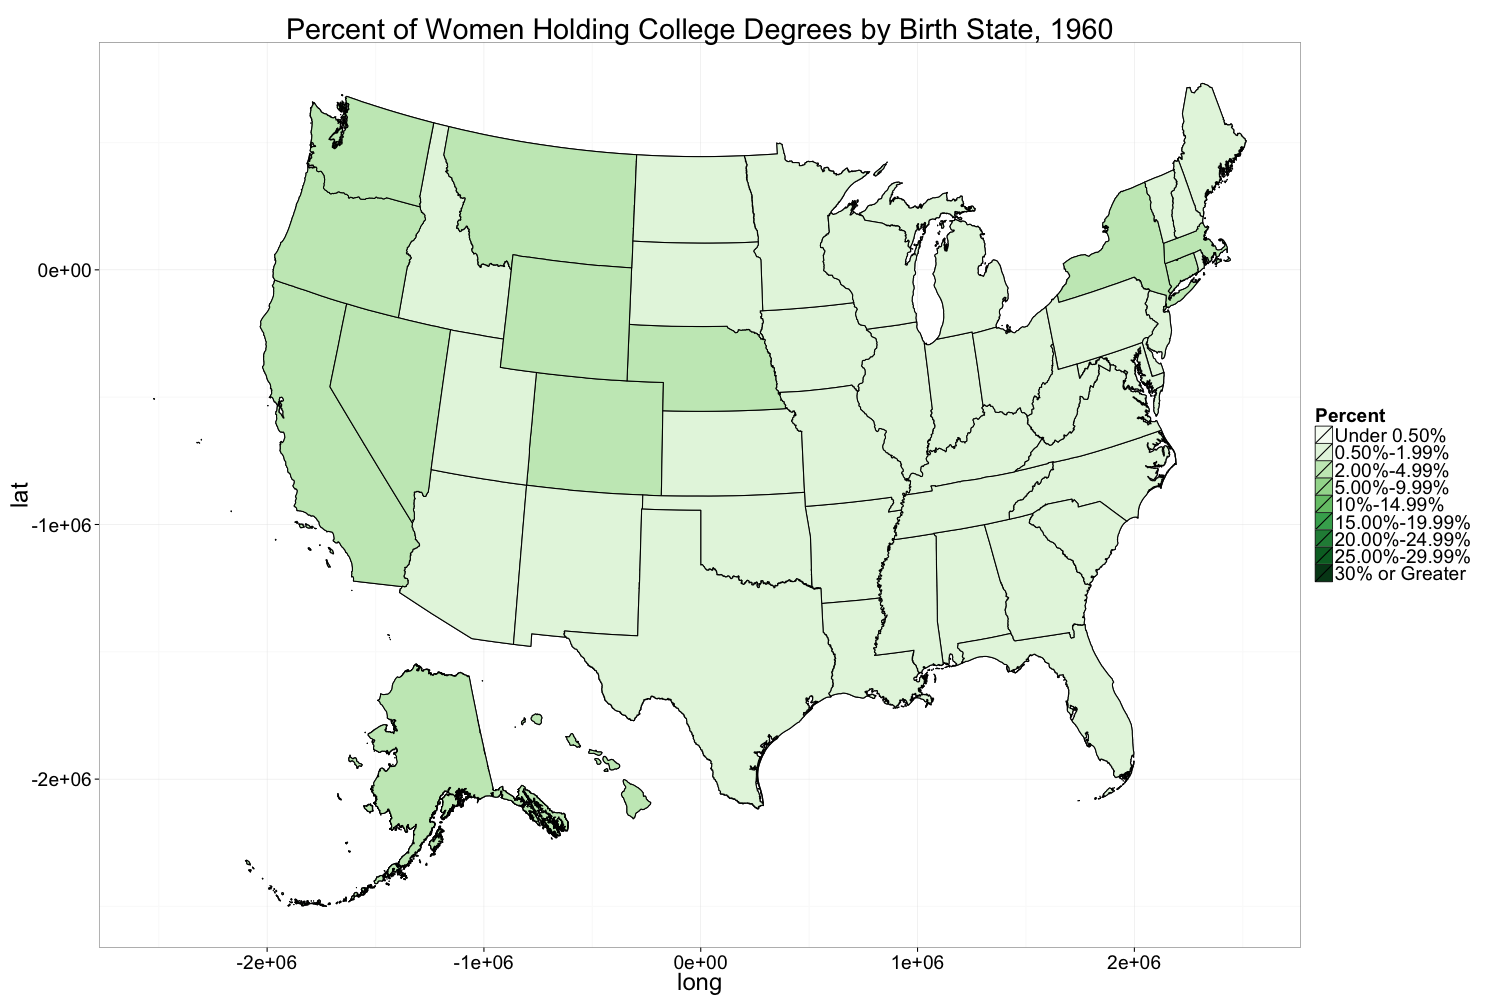
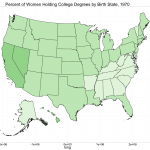
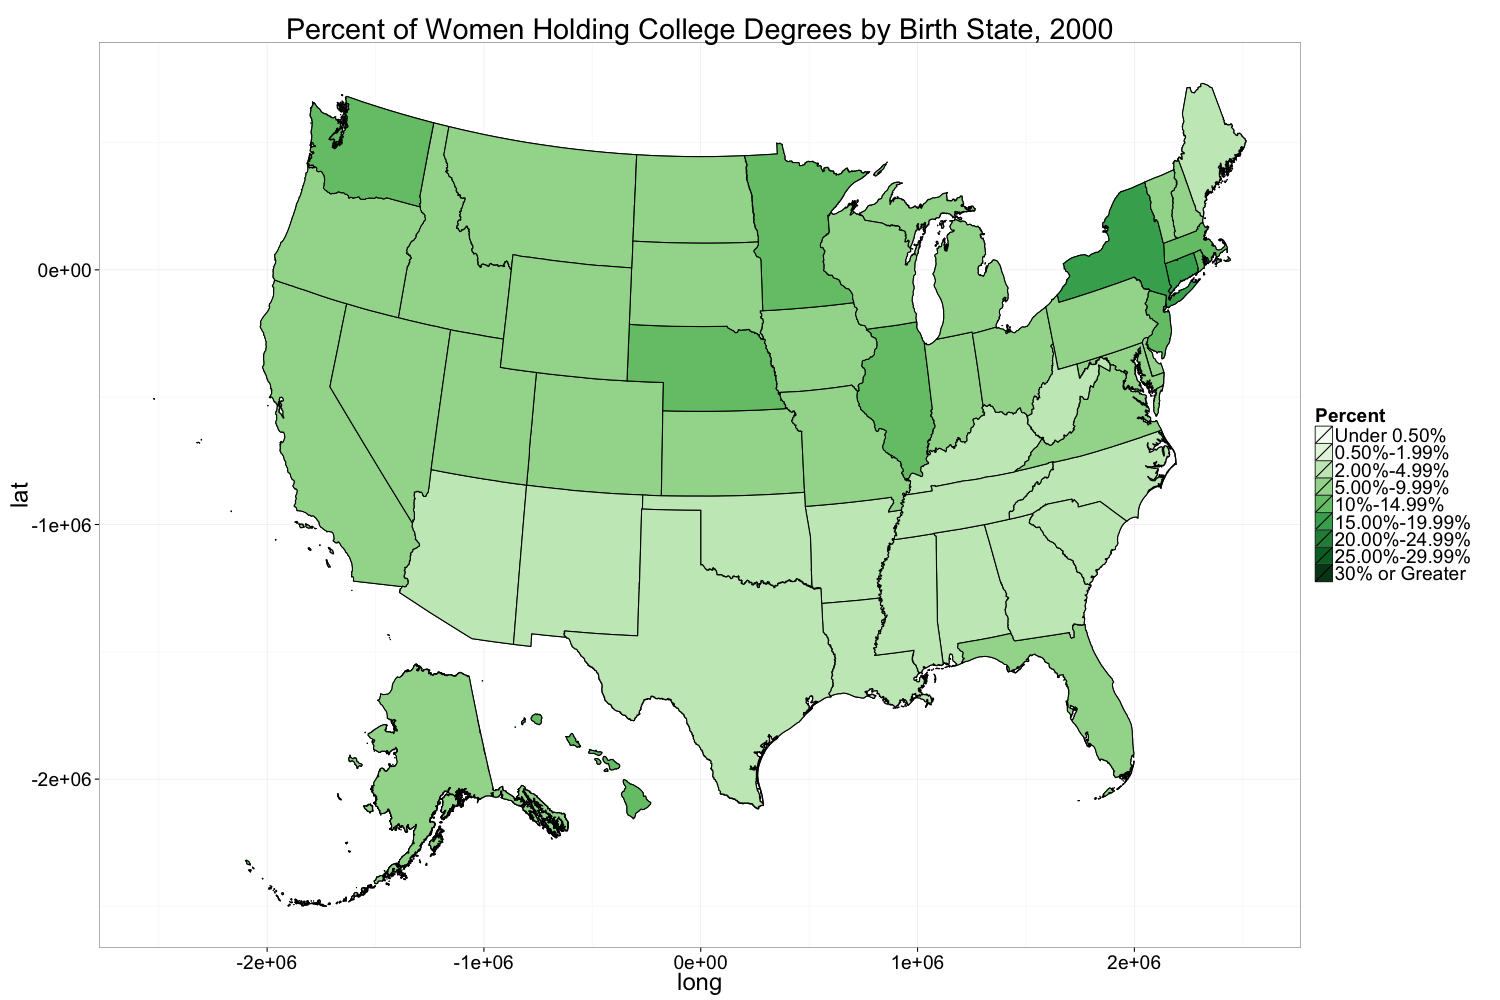
Figures 3-9 show maps of the United States, broken down by state. These maps visualize the percent of women holding college degrees by birth state for each year, 1940-2000. The variables BPL and STATEFIP were used to link women to their state of birth on the map. Code for this visualization available on GitHub.
Figure 10 shows a bar graph of the percent of divorced women for each year. The percent of divorced women was calculated by dividing the number of divorced women by the total number of women in each year. Code for this visualization available on GitHub.
Figure 11 shows a bar graph of the percent of women holding college degrees for each year, again using the EDUCD variable to determine degree-holders. The percent of women holding degrees was calculated by dividing the number of women holding degrees by the total number of women in each year. Code for this visualization available on GitHub.
Figure 12 visualizes the occupation of women by race and year. Using the OCC-1950 variable, which creates occupation categories consistent with the 1950 census, I created 6 occupation variables: none, farm and farm laborers, craftsmen/ operatives/laborers, managerial/clerical/sales, service, and professional. The graph is grouped by race like figures 1 and 2, and again the ‘Other’ category was filtered out. Code for this visualization available on GitHub.
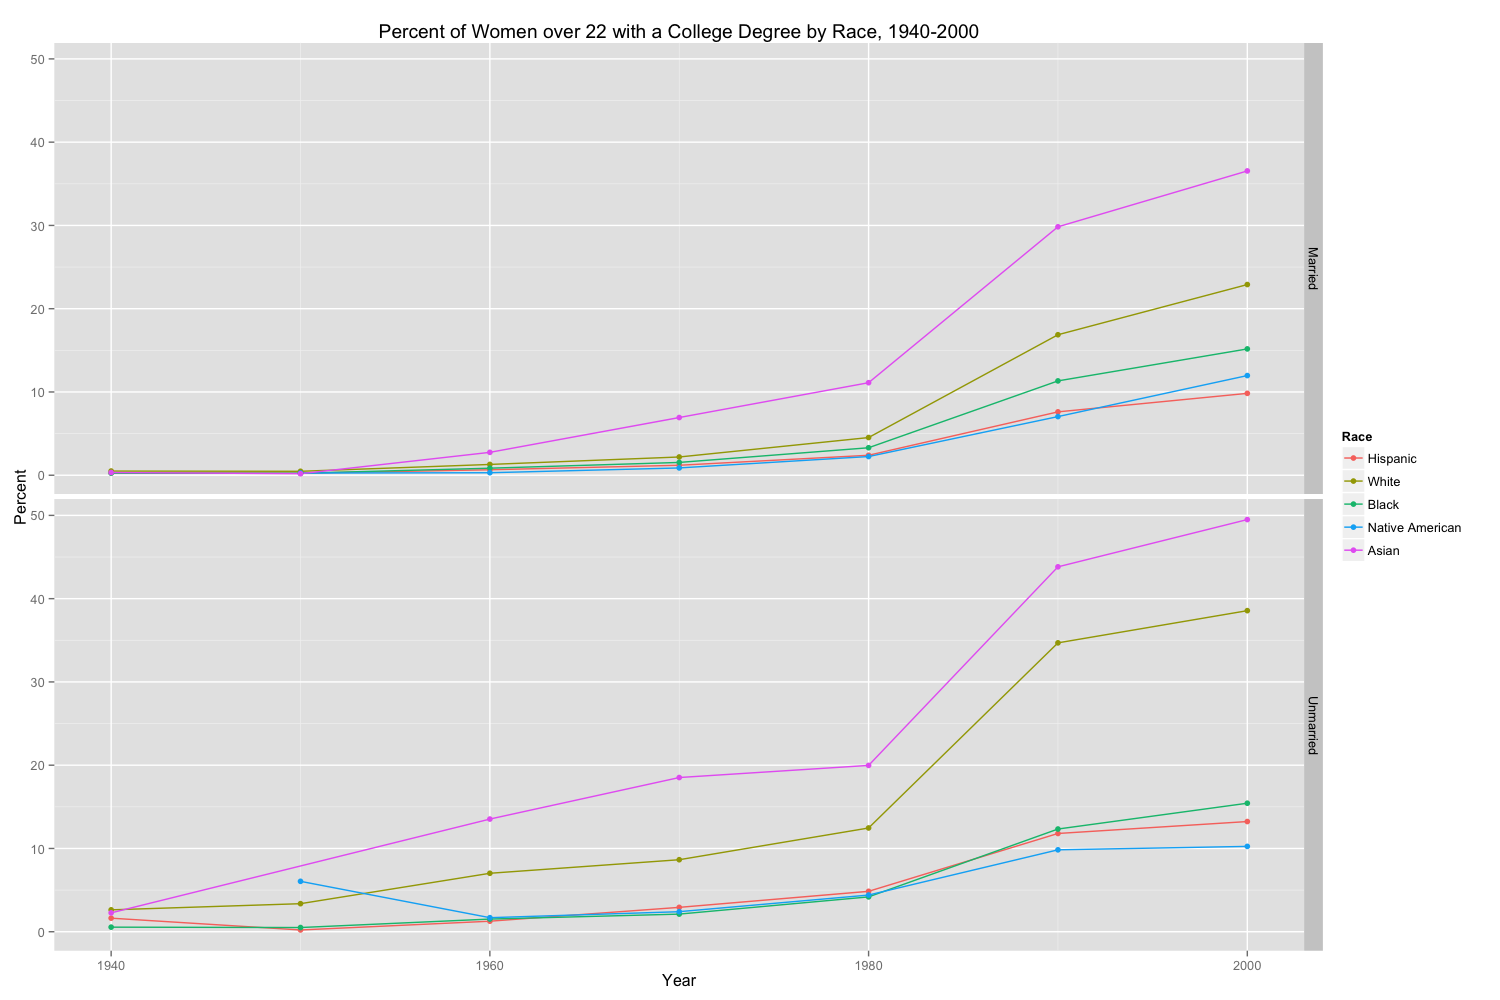
Figure 1 – Percent of Women over 22 with a College Degree by Race, 1940-2000
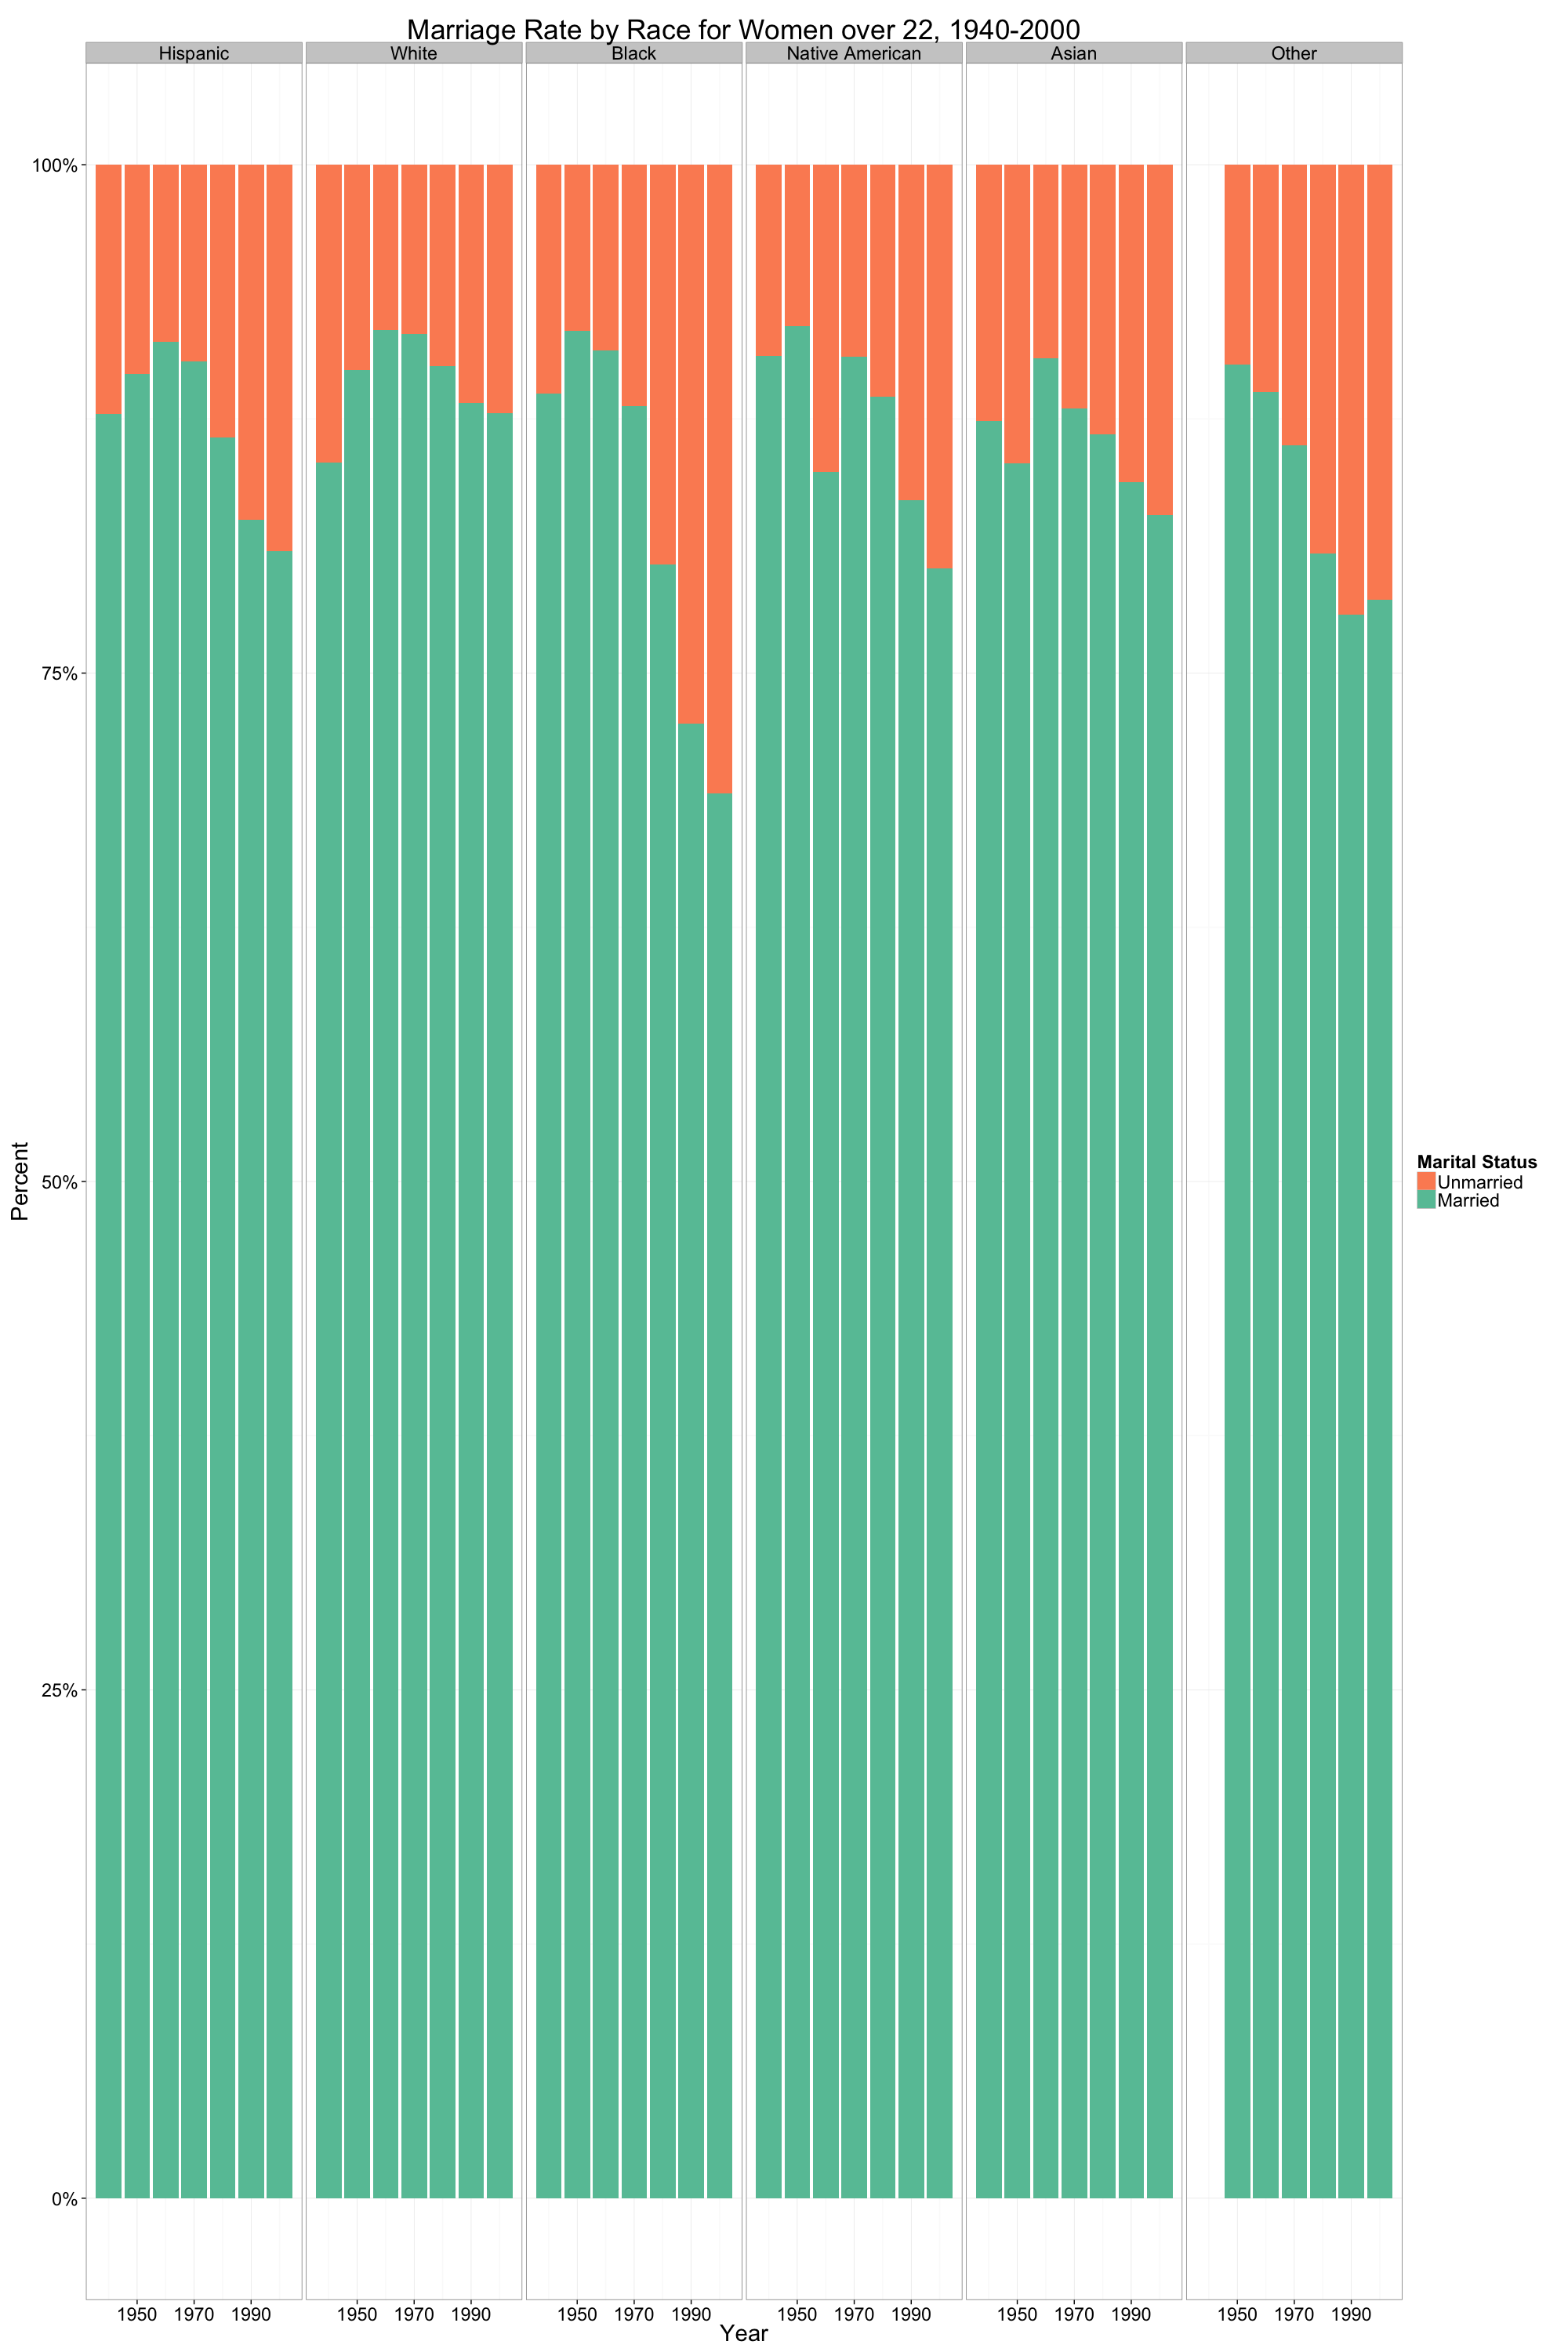
Figure 2 – Marriage Rate by Race for Women over 22
-
- Figures 3 – Percent of Women Holding College Degrees by Birth State, 1940
-
- Figures 4 – Percent of Women Holding College Degrees by Birth State, 1950

-
- Figures 5 – Percent of Women Holding College Degrees by Birth State, 1960
-
- Figures 6 – Percent of Women Holding College Degrees by Birth State, 1970

-

- Figures 7 – Percent of Women Holding College Degrees by Birth State, 1980

-

- Figures 8 – Percent of Women Holding College Degrees by Birth State, 1990

-

- Figures 9 – Percent of Women Holding College Degrees by Birth State, 2000
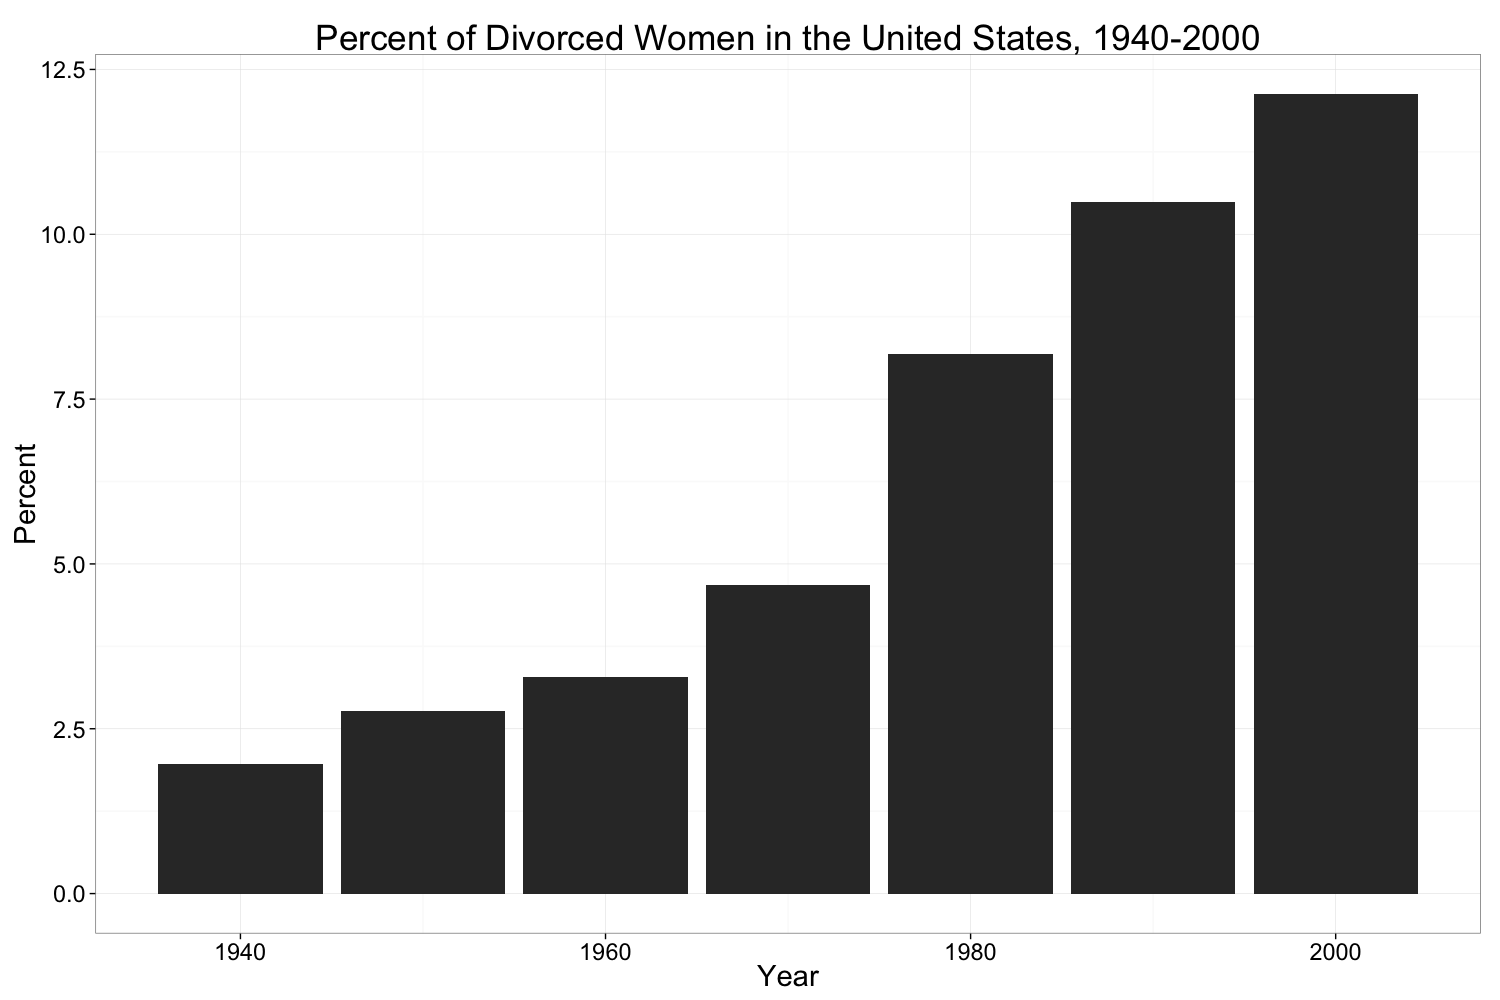
Figure 10 – Percent of Divorced Women in the United States, 1940-2000
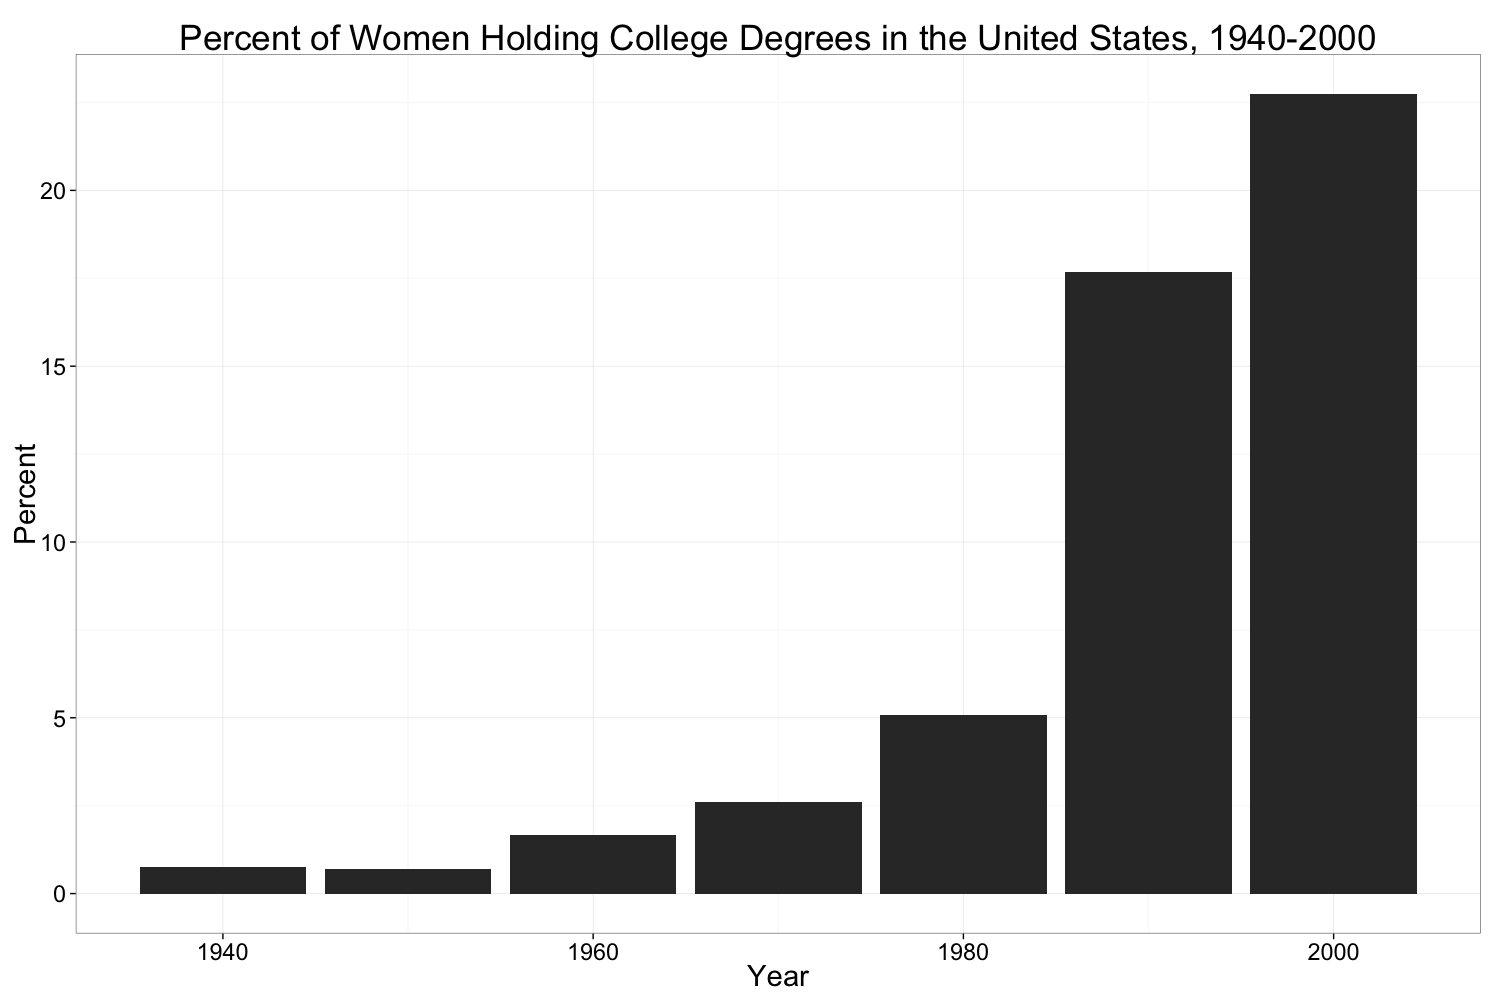
Figure 11 – Percent of Women Holding College Degrees in the United States, 1940-2000
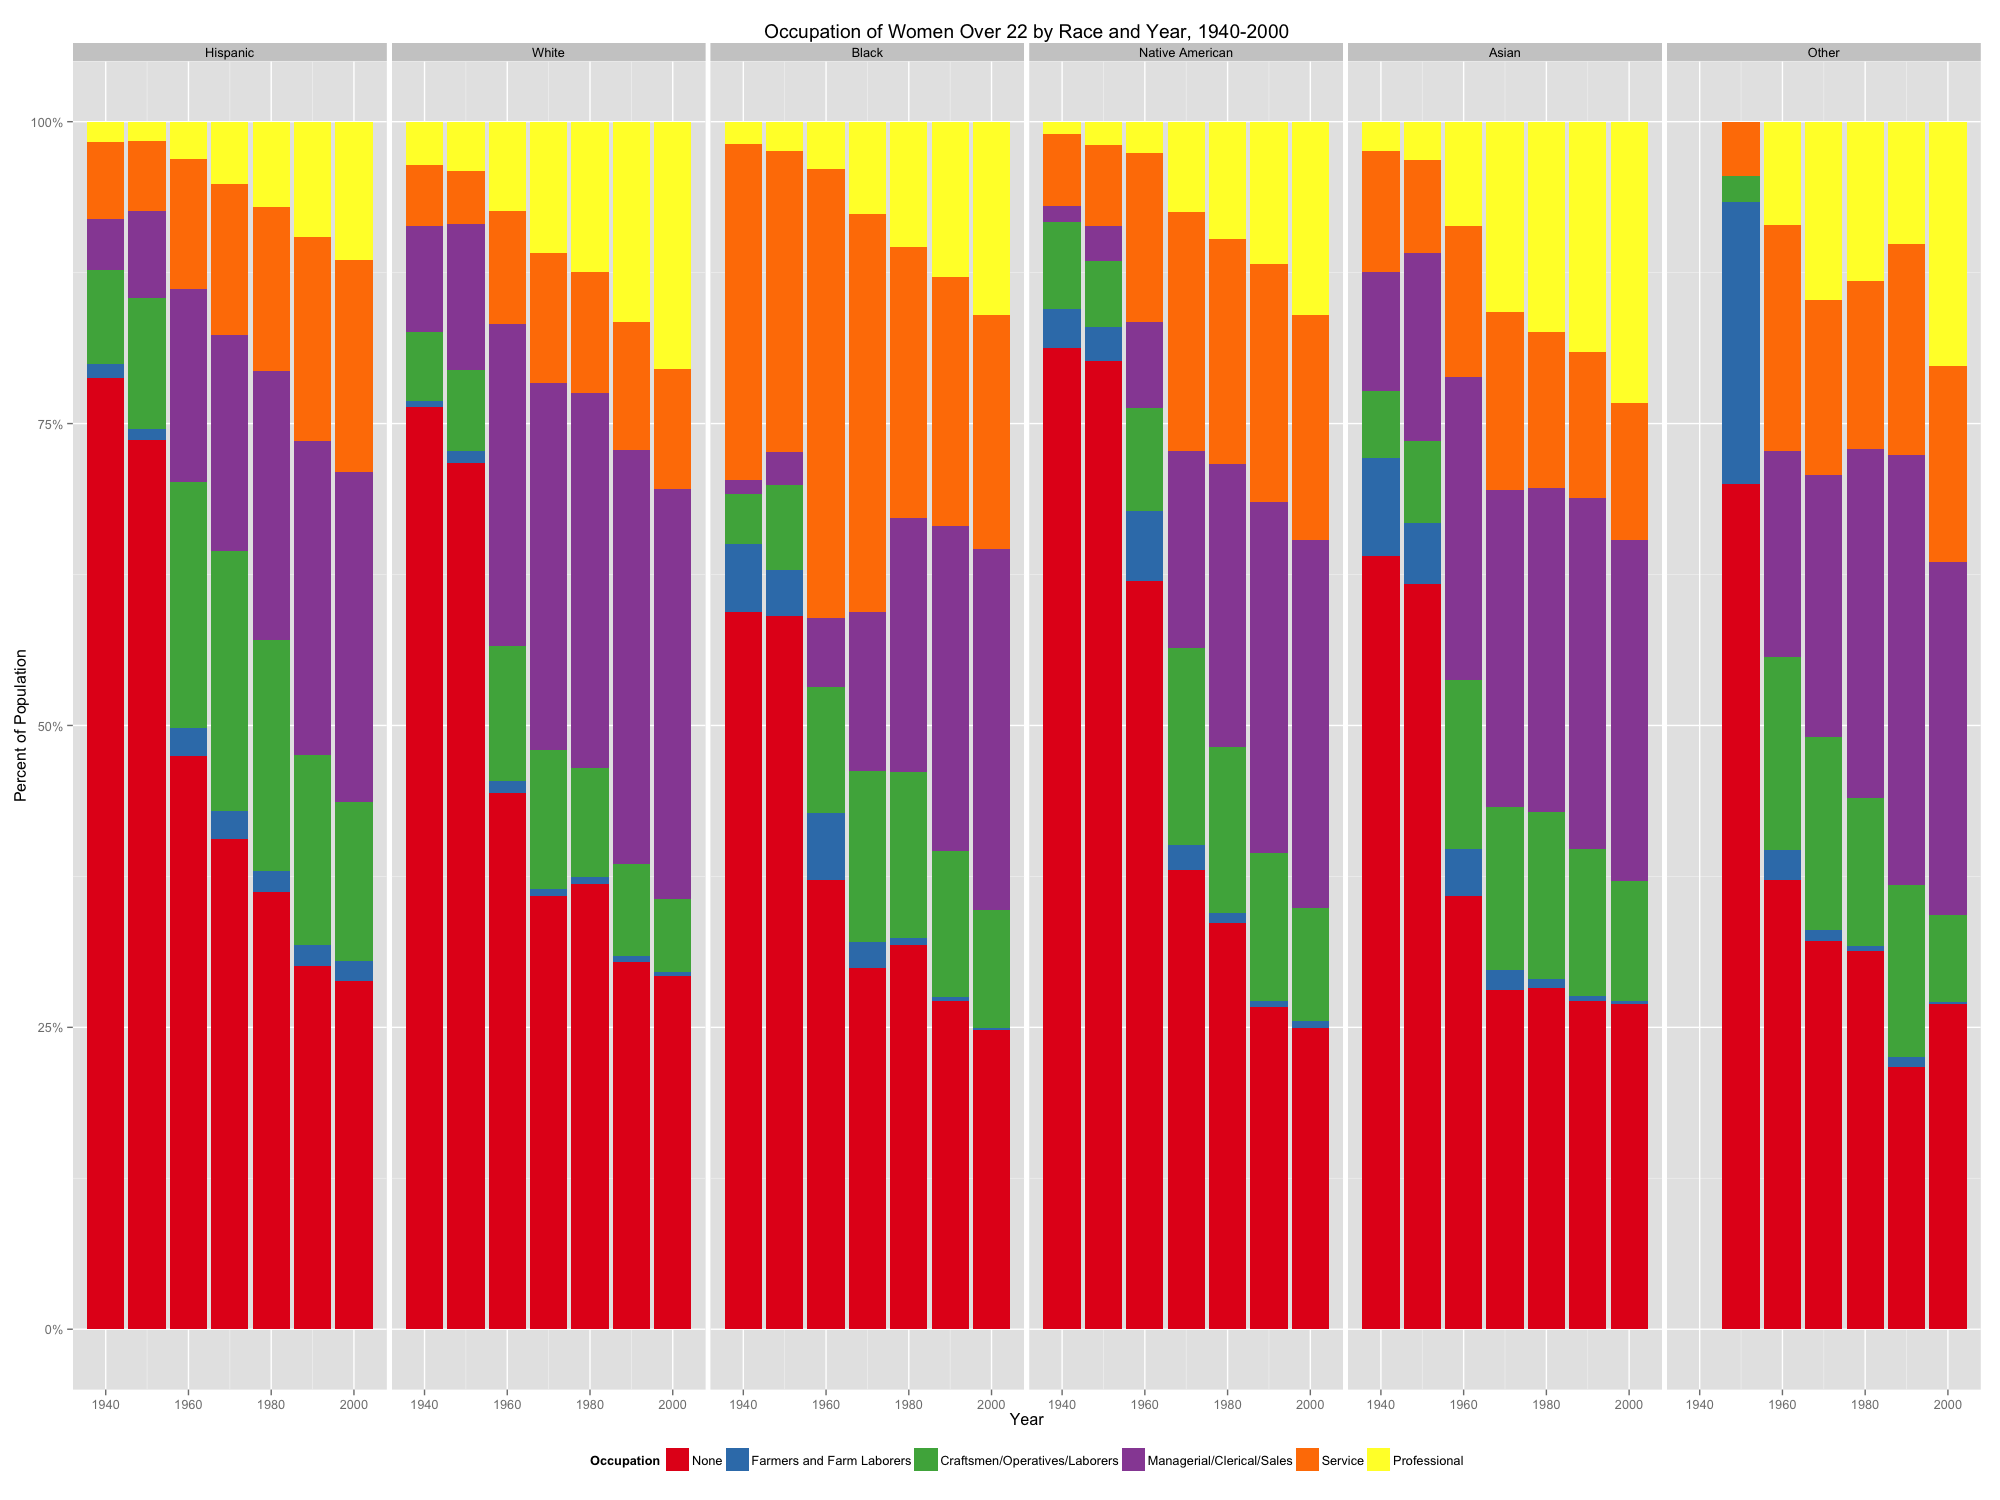
Figure 12 – Occupation of Women Over 22 by Race, 1940-2000
Results and Discussion:
Figure 1 shows the percent of women over 22 with a college degree by race from 1940-2000. Asian women consistently have a higher percent of degree-holders in both the married and unmarried categories, with White women holding the second highest percent in each year for 6 of the 7 years shown. Hispanic, Black, and Native American women have the lower percentages of college degree holders in both categories, married and unmarried, for each year. Overall, more unmarried women hold college degrees than married women. This reflects the work of Stacey Jones, who argues that as social norms tended toward marrying later or not marrying at all, women sought education more and more as a route to reliable income and self-sufficiency. For both White and Asian women, the percent of unmarried women with college degrees is over 10% higher than married women.
Figure 2 shows the marriage rate by race for women from 1940-2000. For Hispanic, White, and Asian women, the marriage rate peaked in 1960 but hovers around 80% for every year shown in the data. The marriage rate for White women is the most stable after the 1960 peak. However, the marriage rate of Black women dramatically drops below 75% after 1950. This is the only race category that drops below the 75% mark in any year. A decreasing marriage rate correlates with and increase in women’s seeking higher education and careers. From “1977 to 1987, the enrollment of women increased by 20%” (Touchton, 50).
Figures 3-9 show maps of the United States with the percent of women holding college degrees by birth state for the years 1940-2000. The progression of the maps shows the overall increase in women holding college degrees in the United States for the time period. The Northeast and the West Coast, specifically California, Washington, New York, Massachusetts, and Connecticut, have the most consistently high percentage of women holding college degrees relative to other states of birth, showing that region of birth influences the likelihood that a woman pursues and earns a college degree.
Figure 10 shows the percent of divorced women and Figure 11 shows the percent of women holding college degrees in the United States from 1940-2000. Together, these two graphs show the correlation between the increasing frequency of divorce and an increase in the percent of college-educated women. Tian Yanfeng summarizes this phenomenon: “the higher the divorce rate, the greater number of women are exposed to increasing deprivation and uncertainty. Consequently, they are motivated to seek alternatives to reduce their uncertainties” (Yanfeng, 4). College is one such route to reduce the uncertainty of the future. The increased prevalence of divorce was one factor in eliminating the traditional, societal idea that men can be depended on to provide lifelong financial support, driving women to seek their own career paths and steady sources of income. A college education can provide this future stability.
Figure 12 shows the percent of women in different occupation categories by race for the years 1940-2000 in the United States. For all race categories, there is a decrease in women without an occupation and an increase in women in the professional segment. In the 1950s and 1960s, “college and university women themselves had limited career ambitions, reflecting the ‘climate of unexpectation’ in the country” (Jones, 262). Hispanic, Black, and Native American women have a smaller percent of women in the professional segment than White and Asian women. Furthermore, more White women are unoccupied than Black women, to an especially significant degree in 1950 and 1960, showing that “full-time homemaking was an unaffordable luxury,” for many race groups (Jones, 256). The percent of women in the service industry is especially higher for Black women than women in other race categories, specifically in the years 1960 and 1970. The different occupational trends for race groups capture the varying but perpetual social norms, expectations, and limits imposed on women of different races in the second half of the twentieth century.
Conclusion:
Women’s role in higher education was not only influenced by the availability of higher education opportunities through the opening-up of colleges and universities across the country, but also greater societal forces were highly influential. Cultural norms and the changing nature of marriage as well as racial discrimination and racial variation impacted women’s enrollment in and completion of college. To sum the trend of women in higher education to one factor overlooks various important influences. Furthermore, although women as a group overall experienced an increase in levels of higher education, each group of women, by race, marriage status, and region of birth, experienced the phenomenon in a unique way with unique influences.
Bibliography:
Drucker, Joshua, “Reconsidering the Regional Economic Development Impacts of Higher Education Institutions in the United States” (Chicago: University of Illinois at Chicago, October, 2014)
Faragher, John Mack and Florence Howe, Women and Higher Education in American History: Essays from the Mount Holyoke College Sesquicentennial Symposia (New York: W.W. Norton 1988).
Feeney, Noah, “Women are Now More Likely to Have College Degrees than Men,” Time, http://time.com/4064665/women-college-degree/
Gilmore, Britney Nicole, “Hispanic Women’s Higher Education Experiences: An Examination of the Influence of Culture and Family” (Austin State University: December 2013).
Jones, Stacey, “Dynamic Social Norms and the Unexpected Transformation of Women’s Higher Education,” Social Science History 33:3 (Fall 2009): 247-291.
Tian, Yanfeng, “Divorce, Gender Role, and Higher Education Expansion” Higher Education 32:1 (July 1996): 1-22.
Touchton, Judith and Lynne Davis, Fact Book on Women in Higher Education (New York: Macmillan 1991)