

Introduction
The “white picket fence” has long been a symbol of American suburbanization. This trope, coupled with aerial images of Levittowns from history textbooks, have etched themselves into the minds of millions of American teenagers across the nation. They represent mid-century transformations in America—a glimpse of life outside of the cities that had spurred the nation’s economic growth at the turn of the twentieth century. In recent decades, American suburbanization has received a plethora of scholarly attention. Much of this academic treatment examines the phenomenon of “white flight,” or the migration of whites to the suburbs, and highlights the federal government’s role in promoting white suburbanization as well as its inherent discrimination against African-Americans and other minorities (Jackson 1985; Massey/Denton 1988). This study analyzes suburbanization in the United States from 1930-2010, and corroborates many of the themes espoused in the literature (Jackson 1985; Massey/Denton 1988; Kruse 2005). Over time, an increasing proportion of the U.S. population resided in metro areas. Growing numbers left cities for the comfort of the suburbs in the mid-to-late decades of the twentieth century. Although white flight was certainly not the sole reason for American suburbanization, when these results are quantified racially, white flight to suburban areas did exist on a significant scale. However, an increasing proportion of minorities, particularly Hispanic-Americans, are beginning to suburbanize. As the literature describes, African-Americans still suffer under the weight of residential segregation, and, with their options limited, remain highly concentrated in urban environments. The final portion of this post turns to Newark, New Jersey, a former industrial hub that is often cited as a characteristic example of twentieth century urban decay. My research found that no single factor can account for Newark’s deterioration. It did, however, experience white flight on a larger scale than the average American city. This precipitous decrease in the workforce, taken with the deterioration in the city’s manufacturing framework and the outsourcing of production to foreign labor, led to Newark’s degeneration. Although there has been significant research into suburbanization in the twentieth century, this study is unique because it compares trends in Newark to the greater United States, an area in need of modern statistical research.
The literature treating suburbanization in the twentieth century United States highlights numerous themes. One of the most common trends emphasizes the federal government’s role in enabling suburbanization in the period leading up to and immediately following the Second World War. From 1930-2010, America underwent enormous cultural, societal, and technological change. According to the 1980 census, forty percent of the American population, or over 100 million people, lived in the suburbs, more than rural areas or cities (Jackson 1985). What caused this development? In Crabgrass Frontier, Kenneth Jackson (1985) argues that the abundance of land and the relative wealth of the population made suburbanization in the United States a unique phenomenon. These assets, coupled with a large federal government that was eager to repay Americans for their sacrifices during World War II through tax, highway, and mortgage subsidies, meant that Americans could leave overcrowded cities for the comfort of the suburbs. Suburbia, then, became a representation of “happiness” and success, rather than simply “housing” (May 1988).
During the postwar period, federal policy “neglected urban centers,” according to Brad Tuttle (2009), and focused instead on the nation’s fledgling highway system and making home ownership and higher education available to white men through the G.I. Bill of Rights, as Elaine Tyler May (1988) points out. Improved transportation capacities triggered manufacturers to search for cheaper real estate outside of urban centers, while Japan and China became major exporters of cheaper goods (Hobbs 2014). Labor was increasingly outsourced to foreigners. The result of these developments was the suffering of port cities across the country. In Newark, for example, between 1970 and 1980, over 600 factories in and around the city shut down. The traditional working class inevitably left the city to find new jobs, and those who stayed were forced to turn to the informal sector of the economy, causing the “dangerous side of urban culture” to emerge (Hobbs 2014). As a result, federal policy enabled white citizens to suburbanize, while those remaining in previous industrial centers struggled to cope with the effects of urban decay.
Another theme described in the literature reflected that whites abandoned urban areas as increasing numbers of African-Americans moved in, and subsequently erected barriers to black assimilation. Across the United States, African-Americans, more than any other race, have suffered under restrictions to equal opportunity. Nowhere is this trend more prevalent than in large northern cities with significant black populations, including New York, Chicago, Detroit, and Newark. According to Douglas Massey and Nancy Denton (1988), these cities were “radically transformed” by the white suburbanization of the 1960s and 1970s that left African-Americans “spatially isolated” in inner city environments. A chief manifestation of residential segregation was redlining. In 1934, Congress created the Federal Housing Administration, which insured private mortgages and triggered a decrease in interest rates, as well as a decline in the size of down payments required to buy a home. Integral to the process was the Administration’s adoption of a ratings system for American neighborhoods according to their “perceived stability” (Coates 2014). On urban maps, green areas rated “A” indicated “in demand” neighborhoods that, as one appraiser explained, lacked “a single foreigner or Negro” (Coates 2014). These neighborhoods were considered insurable locales and good opportunities for investment. Neighborhoods where black people lived were rated “D” and were usually considered ineligible for FHA backing. They were colored in red.
For African-Americans, the effects were devastating. In Black Wealth/White Wealth: A New Perspective on Racial Inequality, Melvin L. Oliver and Thomas M. Shapiro explain,
Locked out of the greatest mass-based opportunity for wealth accumulation in American history, African-Americans who desired and were able to afford home ownership found themselves consigned to central-city communities where their investments were affected by the “self-fulfilling prophecies” of the FHA appraisers: cut off from sources of new investment[,] their homes and communities deteriorated and lost value in comparison to those homes and communities that FHA appraisers deemed desirable (Oliver/Shapiro 2006).
In major cities across the nation, whites seeking to achieve the American dream could rely on a legitimate credit system backed by the government. On the other hand, blacks were victimized by unscrupulous lenders who took advantage of their situations (Coates 2014). By preventing investment in racially integrated neighborhoods, the FHA enabled and promoted white suburbanization to a significant degree. Although this radical isolation has slowly given way to increasing numbers of African-Americans joining the suburban movement in recent years, significant challenges, including sustained residential segregation, remain (Massey/Denton 1988).
The second portion of this post involves a case study of Newark, New Jersey. Once an industrial and manufacturing giant, as well as home to some of New Jersey’s most prominent families, Newark has since become synonymous with twentieth-century urban decay. For the past fifty years, the “Brick City” has been tainted by political corruption, evidence of police brutality, and rampant substance abuse. This degeneration has been largely blamed on white flight and the subsequent urban poverty of the city’s abandoned areas.
In the early twentieth century, Gregory (2005) notes the tremendous effect that African-American migrants from the southern United States engendered on the creation of northern “Black Metropolis[es],” such as Newark. By 1940, eight cities, of which Newark was a key member, had become home to two out of every three southern-born African-Americans who lived outside of the South (Gregory 2005). This mass migration, in turn, played a large role in Newark’s transformation. The wide range of skills and talents that these migrants brought with them did not save the city from serious urban decay, however. Tuttle (2009) characterizes the forces afflicting Newark as the “perfect storm” of urban difficulties that decimated many of the nation’s largest cities: political corruption, industrial abandonment, white flight, racial conflict, soaring crime, fiscal insolvency, and dire poverty. Newark experienced all of these problems to an extreme degree.
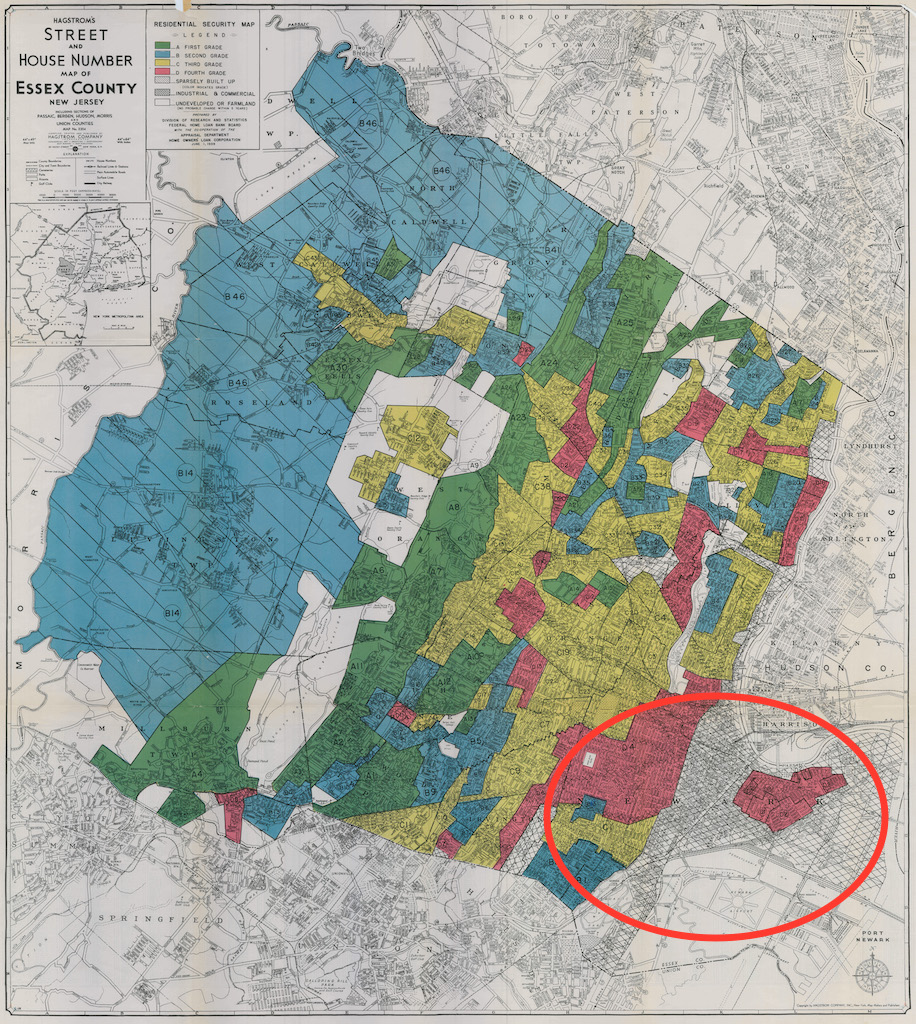
Figure 1: Redlining in Essex County, New Jersey. Newark is circled in the bottom right corner of the map. Image source: https://dl.dropboxusercontent.com/u/3961868/HOLC%20Maps/HOLC/EssexCountyNJHOLC-MED.jpg
As articulated above, federal government policies, improved transportation capacities, and the increased use of foreign labor all functioned significantly in the degeneration of the Port of Newark. In Figure 1, for example, Newark is almost entirely redlined and therefore suffered from severe disinvestment. There are additional reasons for the city’s deterioration and resulting mass exodus, however. An important portion of the blame rests with the city’s leadership, whose “decades of mismanagement,” manifested primarily in “bloated” government agencies and an ineffective and patronage-laden bureaucracy, resulted in high tax rates and rampant political scandal (Tuttle 2009). Between 1952 and 2006, Newark had only four mayors, three of which faced indictments for corruption either during their time in office or immediately afterwards. Because Newark is so small (only twenty-four square miles), it could not shoulder all of its internal problems. People of means left Newark in astonishing numbers (between 1960 and 1990, Newark lost nearly one-third of its population, or 125,000 people) to pursue low-rate mortgages in the suburbs, leaving the tax burden to those who could not afford it (Tuttle 2009). By 1967, according to Tuttle (2009), seventy-five percent of whites and eighty-seven percent of African-Americans were renters because they could not pay for their own homes. After emerging from the Newark Riots in 1967, the city plunged into a period of such decline that Harper’s labeled it the “worst American city” in 1975 (Tuttle 2009).
In recent years, however, there is hope that Newark is undergoing a renaissance. A burgeoning real estate market, evidenced by the construction of multiple sports arenas in the city, has begun to take root. The police department has been overhauled (Phippen 2016). Finally, Newark’s population is growing once again.
Data and Methods
In conducting my analysis, I employ five visualizations illustrating various elements of suburbanization during 1930-2010. Three visualizations study the United States as a whole, and two diagrams focus explicitly on Newark. All data are drawn from the Integrated Public Use Microdata Series (IPUMS). Because of my selected variables and case-study of Newark, my sample size varied depending on the year and availability. As a result, I used the following IPUMS samples: 1930 (5%), 1940 (1%), 1950 (1%), 1960 (5%), 1970 (1% state form 1), 1980 (5% state), 1990 (1%), 2000 (5%), 2010 (ACS 5 yr). All data are weighted by PERWT.
Figures 2 and 3 study the relationship between the American population and metro areas from 1930-2010. Figure 2 is an animated map of the United States representing the percentages of people who reside in metro areas (in each state) during this period. “Metro areas” is defined as cities and suburbs. Data for Alaska and Hawaii are not available in 1940 and 1950. Building on Figure 2, Figure 3 differentiates between cities and suburbs by portraying the percentages of the American population residing in urban versus suburban areas. Alaska and Hawaii are excluded.
Figure 4 again differentiates between those living in cities or suburbs, but quantifies these individuals by race. Since race and ethnicity are separate categories in the census, I employed the IPUMS-specific variables HISPAN and RACESING to first identify whether a person was Hispanic and, if not, to place them into a single race category according to IPUMS specifications. There are four primary racial categories: (1) White; (2) African-American; (3) Hispanic; and (4) Other. I selected these categories because they are well-represented within metro areas and thus presented a diverse opportunity for analysis. Alaska and Hawaii are once again excluded.
The next two visualizations concentrate specifically on Newark. Data are drawn from IPUMS under the CITY variable, code 4630. There is no available data for Newark in 1940-1950 or 1970. Figure 5 is a population pyramid for Newark residents from 1930-2010. I employ the same racial categories as in Figure 4. Figure 6 describes the percentage of Newark’s working-aged (15-65 years of age) population engaged in certain industries over time. The industrial categories are constructed from the IPUMS variable IND1950, which provides a consistent set of (industrial) categories over time. I have allotted the IPUMS codes for IND1950 into seven broad industrial groupings, using the subheadings provided by IPUMS (https://usa.ipums.org/usa-action/variables/IND1950#codes_ section): none (including no response and non-occupational responses), agricultural/extractive (agriculture, forestry, fishing, and mining), manufacturing (including durable and non-durable goods), construction or general labor (including “common or general laborer”), trade (including wholesale and retail), transportation/communication/utilities, and services (finance, insurance and real estate; business and repair; personal; entertainment and recreation; professional; and public administration).
Link to code can be found here.
Results
The United States has become more metropolitan over time.
Figure 2: Animated map showing the percentage of people residing in metro areas in the United States, 1930-2010.
Figure 2 demonstrates that over time, there is an increasing proportion of Americans living in metro areas. In 1930, for example, only three states (Michigan, Ohio, and Maryland) had over 65% of people living in metro areas. By 2010, this number had risen to nine states (California, Nevada, Washington, Michigan, Virginia, Massachusetts, Missouri, Illinois, and Minnesota). The breakdown of the number of states containing significant proportions of their populations within metro areas is as follows:
- 1930: 3 states with 65%+
- 1940: 4 states with 65%+
- 1950: 4 states with 65%+
- 1960: 6 states with 65%+
- 1970: 6 states with 65%+
- 1980: 12 states with 65%+
- 1990: 10 states with 65%+
- 2000: 8 states with 65%+
- 2010: 9 states with 65%+
It is not surprising that a large number of Americans live in metropolitan areas (that is, in both cities and suburbs). The reasons for this development are twofold. First, more people did in fact move to these areas. In addition, as the population expanded and America continued to develop, more areas came under the umbrella of “metropolitan.” As a result, suburbanization is best construed as a change in what metropolitan areas were and how people came to inhabit them. It is important to note that people also moved from rural areas to suburbs, partially accounting for the increasing proportion of people living in metro areas. Nevertheless, although a large portion of the population moved to suburbs during the twentieth century (Jackson 1985), cities remain central to the American way of life in character, opportunity, and population. Even as whites left cities for suburbs, African-Americans and Hispanics moved in to fill their place. As Gregory (2005) notes, the Great Migrations, in particular, had an enormous impact on the development and composition of northern cities, leading to widespread demographic and geographic changes in the United States.
In the last four decades, however, trends in the data suggest that people are slowly leaving metro areas in what scholars label the “rural rebound.” Although the first signs of this revival manifested themselves in the 1970s, it has accelerated since 1990 as more people move from urban to rural environments and fewer people decide to leave (Johnson 1999). In many ways, Kenneth Johnson (1999) notes, the causes of the rural rebound mirror those of suburbanization earlier in the twentieth century, namely “transportation and technological innovations that diminished the need for geographic proximity, the desire for more space and a better environment for family life, dissatisfaction with the style and pace of city life, and concerns about the changing racial structure of the city.” Although it is outside the scope of this report, it would be worthwhile to scrutinize whether this rural revival continues.
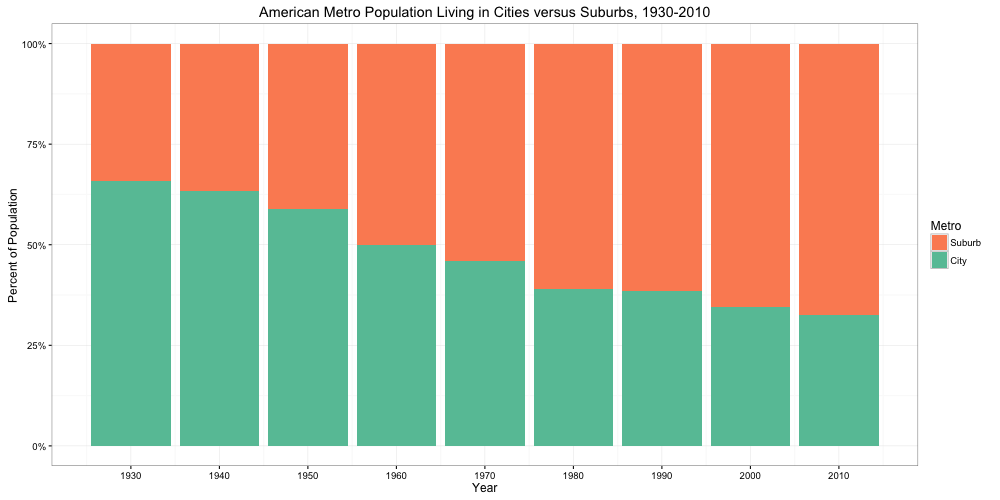
Figure 3: Column graph showing the proportion of metropolitan Americans living in cities versus suburbs, 1930-2010.
Although increasing numbers of Americans moved into metro areas from 1930-2010, Figure 3 shows that a growing proportion of people left cities to move to the suburbs during this time period, reflecting the wide scale suburbanization described in the literature (May 1988; Kruse 2005; Massey/Denton 1988; Hobbs 2014). In 1930, over sixty percent of the American population registered as living in cities. By 2010, that number had declined to approximately thirty percent. There are a number of reasons for this decline. An important factor was white flight, as Figure 4 will show (Tuttle 2009; Massey/Denton 1988; Hobbs 2014). Taken with the copiousness of developable land, the government’s use of tax, highway, and mortgage subsidies meant that an increasing number of (white) Americans could leave cities for the suburbs (Jackson 1985). This, after all, was inherent in the creation of the modern American dream.
Minority influx was one cause of white flight, yet suburbanization was not purely white. African-Americans, in particular, Still encounter obstacles.
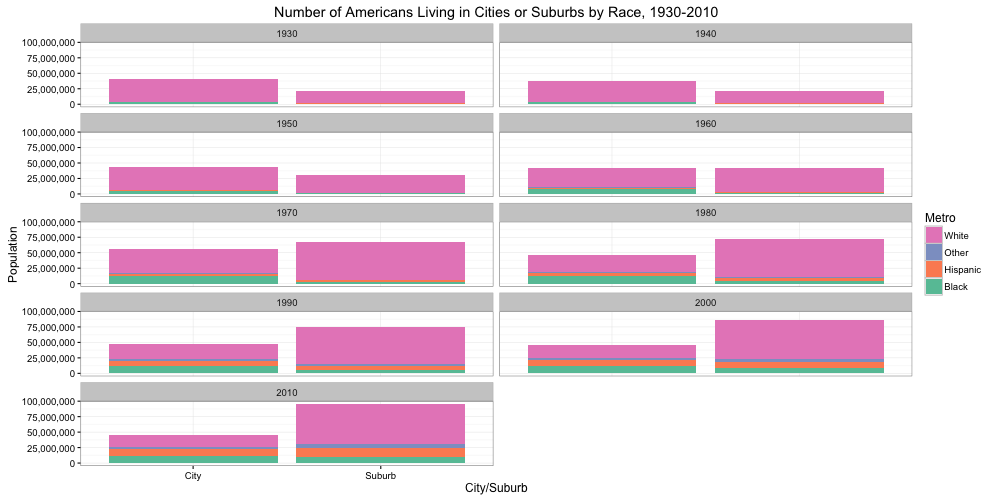
Figure 4: Column graph quantifying the absolute number of Americans living in cities versus suburbs by race.
Figure 4 quantifies the number of people living in cities versus suburbs by race. Although whites remain the largest race represented in suburban areas, the number of whites in urban areas declines over time, symptomatic of white flight. In 1990, for example, whites constitute only a small majority of those living in American cities, and by 2000, minority groups represented the majority of those residing in urban areas for the first time. As a result, the number of African-Americans and Hispanic-Americans in both cities and suburbs, but particularly in cities, is increasing. Although we only see a significant number of Hispanic-Americans moving into urban environments in 1990, by 2000, they had achieved parity with African-Americans in these areas.
Furthermore, observing trends in black residential patterns over time confirms Gregory’s (2005) claim of the creation of the “Black Metropolis.” African-Americans constitute a larger portion of the urban population in each successive decade (Kruse 2005). It is worth noting that the number of Americans residing in suburban areas achieved parity with those living in urban areas for the first time in 1960 and surpassed urban populations in 1970. This timing coincides with the peak of the Second Great Migration, where thousands of African-Americans traveled to northern cities (Gregory 2005). As this “southern diaspora” gained speed, white Americans became increasingly wary (Gregory 2005). For example, a mid-century survey cited by May (1988) found only forty-five percent of whites outside of the South would remain in a neighborhood if a significant number of people of color moved in. Kevin Kruse’s research corroborates these findings: 60,000 whites fled Atlanta in the 1960s, and 100,000 left the city in the 1970s (Kruse 2005). Thus, particularly between 1960-1980, as more blacks moved into urban areas, we see the proportion of whites in cities decline. This was white flight.
However, suburbanization is not only white. Increasing numbers of minorities joined the suburban movement over the course of time as they acquired the resources and means to leave cities (Massey/Denton 1988). Despite Hispanic-Americans relatively recent emergence into urban and suburban populations, they have entered suburban areas more swiftly than African-Americans. These trends suggest Tolnay’s (2005) hypothesis that African-Americans were forced to settle for a “more restricted set of destination options” than their counterparts after the Great Migrations possesses validity. Whites increasingly restricted housing options and limited “occupational opportunities” for African-Americans, resulting in “very high” levels of “residential segregation” and employment discrimination in certain northern cities (Tolnay 2005). Redlining, moreover, existed on a significant scale. All of these observations lead to Massey and Denton’s (1988) conclusion that African-Americans, more than other minorities in the modern era, remain “highly concentrated” in cities, and, within these areas, experience significant “spatial isolation.” As a result, the data suggest that federal policy during this period opened doors for a select group of citizens to prosper and to suburbanize, while largely disregarding those left in the nation’s former industrial centers.
Newark was hard hit by white flight and urban decay, but there are signs of a revival.

Figure 5: Population pyramid for Newark, New Jersey residents, 1930-2010.
Figures 5 and 6 introduce us to the city of Newark, New Jersey. To understand the city and its development, it is necessary to comprehend first its demographic composition. Figure 5 reveals the extent to which this composition has changed from 1930-2010. As the literature describes, Newark’s population shrank dramatically during the twentieth century (Hobbs 2014). Between 1960 and 1990, 125,000 people left the city (Tuttle 2009). The data reflect these trends. The white population in Newark declined precipitously between 1930 and 1990. Whereas the white population in the city was growing in 1930, it has almost disappeared by the latter half of the twentieth century. This population decline was partially attributable to significant redlining in the city (see Figure 1), which discouraged investment. It was accompanied by a burgeoning African-American and Hispanic population in 1980, suggesting that the influx of minorities played at least a partial role in the white exodus from Newark (Gregory 2005). In an interesting development, however, the black and Hispanic populations have remained relatively stable since that time, showing neither signs of increasing nor decreasing. Because Newark’s population is growing for the first time in decades according to the U.S. Census Bureau (USCB), I would anticipate these numbers to increase going forward.
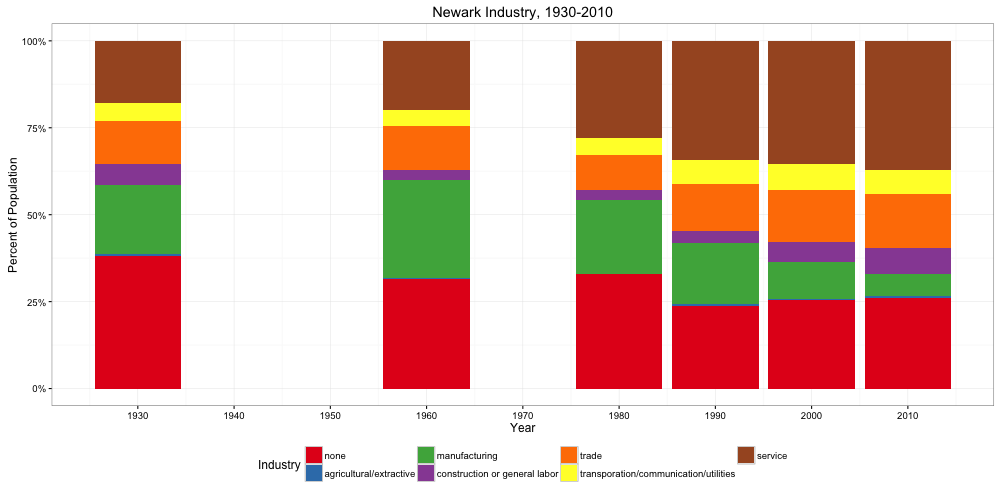
Figure 6: Column graph depicting Newark industry, 1930-2010.
Figure 6 examines the development of Newark industry between 1930-2010. The trends in the data correspond to much of the literature surrounding Newark’s decay (Tuttle 2009; Hobbs 2014). While the trade, construction, and transportation/utility industries remain relatively constant, there is a precipitous decline in manufacturing jobs over the course of time. This trend is indicative of the city’s industrial deterioration as labor was outsourced to foreign countries and much of the populace moved out of the city (Tuttle 2009). By 2010, manufacturing played a minimal role in Newark’s economy (the smallest, save agriculture, of all the industries examined). In contrast, however, the service industry absorbed more labor and has continued to grow. These service jobs range from restaurants to plumbers, and have continued to thrive in troubled economies such as Newark’s. There are several plausible explanations for this trend. First, many corporations and financial services industries (such as Prudential, for example) have large offices in Newark. Moreover, the continued increase in these service jobs also suggests that Newark is potentially undergoing a renaissance of sorts, as new sporting arenas in the city have led to an increase in restaurants in the city’s East Ward, for example. Time will tell if this revival is sustained, or merely a temporary phenomenon.
Conclusion
White flight and suburbanization in the United States are complex phenomena that have been studied extensively in recent years. From 1930-2010, an increasing proportion of the U.S. population resided in metro areas. Over time, within these metro areas, Americans left cities for the suburbs. After quantifying this development racially, I found that white flight to suburban areas was an aggressive trend. Although the influx of minorities certainly played a role in this transition, there was no one particular reason that whites suburbanized. In reality, a myriad of factors, including industrial abandonment, federal programs (albeit, only open to whites), and minority migration, all contributed to the phenomenon that came to be known as white flight. In addition, this study finds that an increasing proportion of minorities, particularly Hispanic-Americans, are suburbanizing. African-Americans have begun to suburbanize in small numbers, but generally remain highly concentrated in urban environments.
The second half of this report examines Newark, New Jersey. Similar to the greater United States, I found that Newark did not decay in the twentieth century for one particular reason. Whites did flee the city at an alarming rate, however. This population decline, taken with the city’s industrial collapse, as well as the outsourcing of production to foreign labor, led to Newark’s degeneration. Nevertheless, although it will likely never be the industrial giant it once was, the city’s growing population, burgeoning real estate market, and strong service industry all indicate Newark is on the verge, if not undergoing, a renaissance.
Works Cited
Coates, Ta-Nehisi. “The Case for Reparations.” The Atlantic. June 2014 Issue. Found online at http://www.theatlantic.com/magazine/archive/2014/06/the-case-for-reparations/361631/ (accessed 7 November, 2016).
Gregory, James N. “Chapter 1: A Century of Migration.” Found in The Southern Diaspora: How the Great Migrations of Black and White Southerners Transformed America. Chapel Hill: University of North Carolina Press, 2005.
Hobbs, Jeff. The Short and Tragic Life of Robert Peace: A Brilliant Young Man Who Left Newark for the Ivy League. New York: Scribner, 2014.
Jackson, Kenneth T. Crabgrass Frontier: The Suburbanization of the United States. New York: Oxford University Press, 1985.
Johnson, Kenneth M. “The Rural Rebound.” Population Reference Bureau: Reports on America. 1:3. (1999). 1-21.
Kruse, Kevin Michael. White Flight: Atlanta and the Making of Modern Conservatism. Princeton: Princeton University Press, 2005.
Massey, Douglas and Nancy Denton. “Suburbanization and Segregation in U.S. Metropolitan Areas.” American Journal of Sociology. 94:3. (1988). 592-626.
May, Elaine Tyler. Homeward Bound: American Families in the Cold War Era. New York: Basic Books, 1988.
Oliver, Melvin L. and Thomas M. Shapiro. Black Wealth/White Wealth: A New Perspective on Racial Inequality. New York: Routledge, 2006.
Phippen, J. Weston. “Changes to Newark’s Troubled Police Department.” The Atlantic. http://www.theatlantic.com/national/archive/2016/03/newark-doj-police/476022/ (accessed 13 November, 2016).
Tolnay, Stewart E., et al. “Distances Traveled During the Great Migration: An Analysis of Racial Differences Among Male Migrants.” Social Science History. 29:4. (2005). 523-548.
Tuttle, Brad R. How Newark Became Newark: The Rise, Fall, and Rebirth of an American City. New Brunswick, NJ: Rutgers University Press, 2009.
United States Census Bureau. “Quick Facts: Newark, New Jersey.” http://www.census.gov/quickfacts/table/PST045215/3451000 (accessed 26 October, 2016).