


Now the program is set up, we solve the PDE with N=5 and N=10. The solution map is included below.
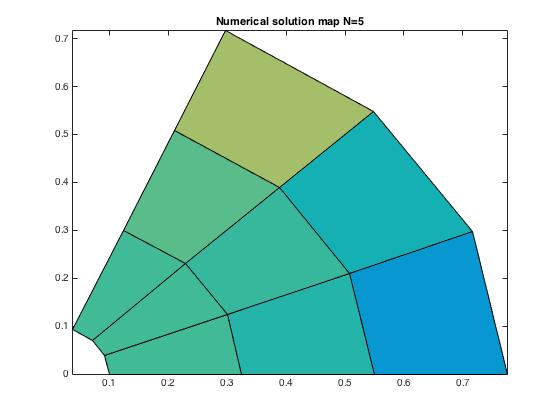
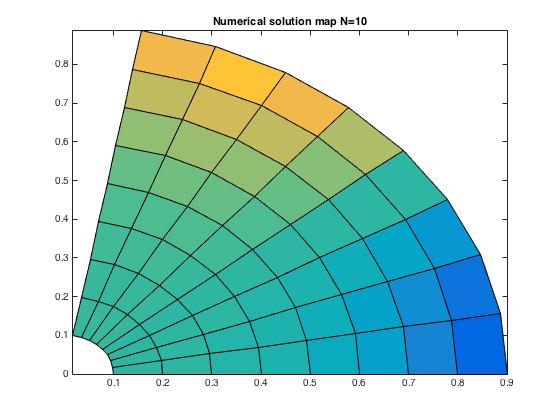
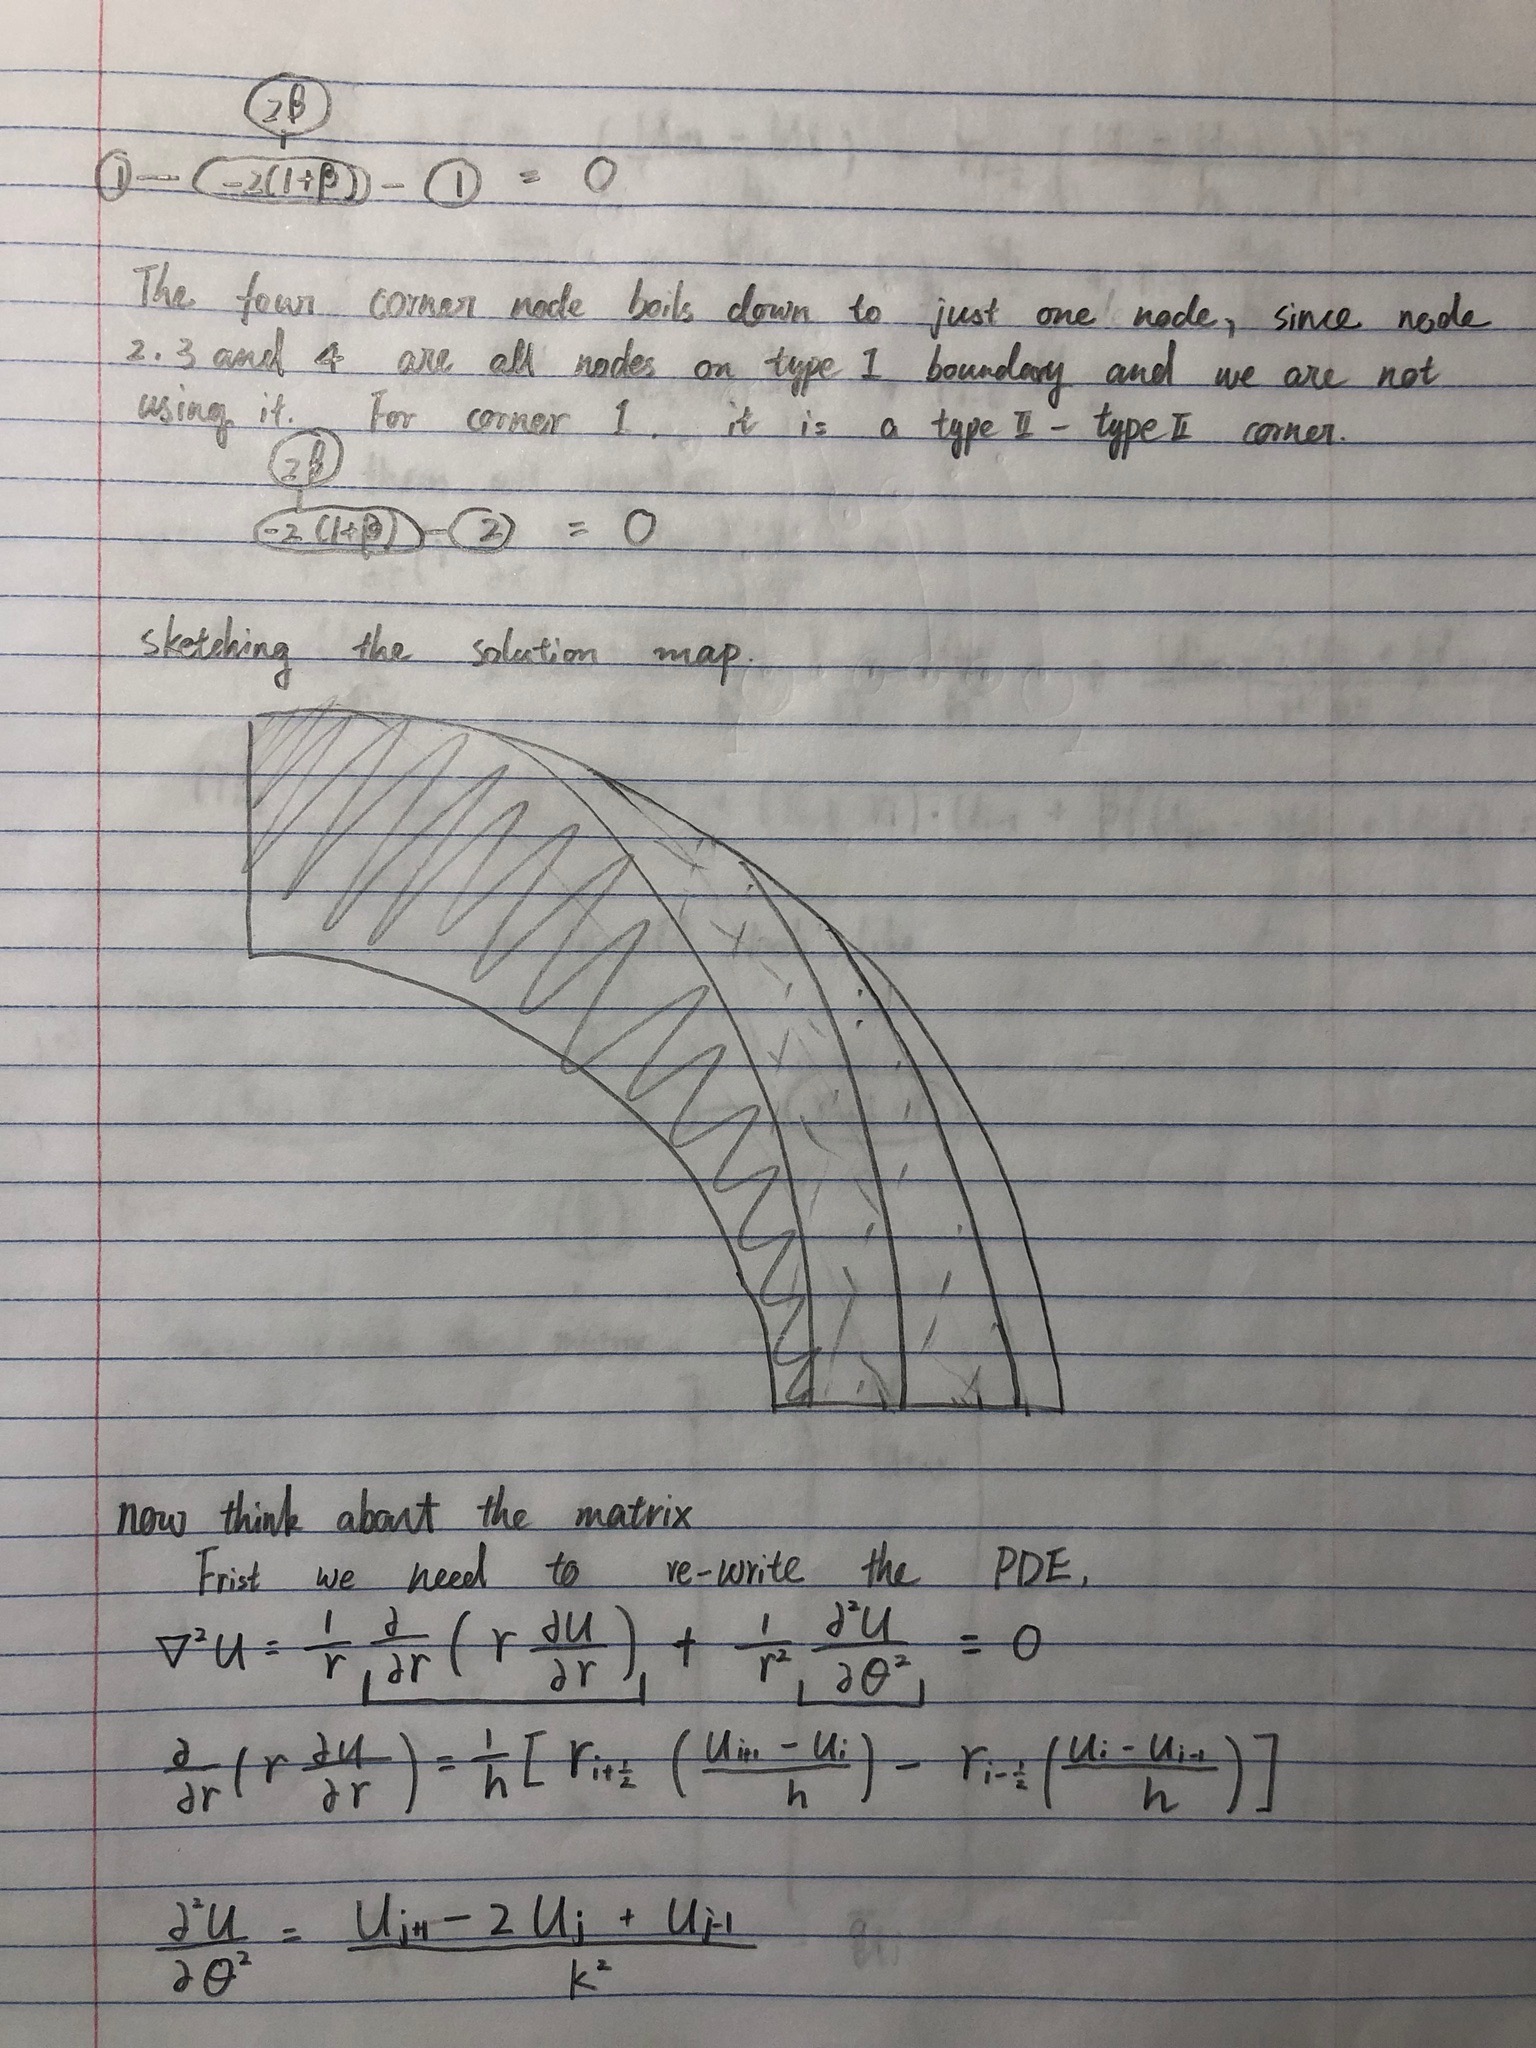
The numerical solution map agrees with my sketch. And the analytic solution map is included too.


Now for a range of N, we can compute the RMS and compare the error propagation as delta r changes. I picked N=5, 10, 50, 100, and 150. And the error vs delta r plot is shown below.
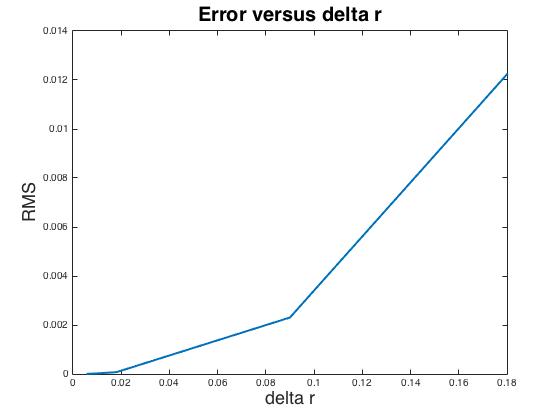
As we can see that, as delta r decreases the error decreases too. The curve is going to plateau as the step size gets finer. N=100 is picked as a converged high N to calculate the numerical solution. The solution map is plotted below with the analytical solution.

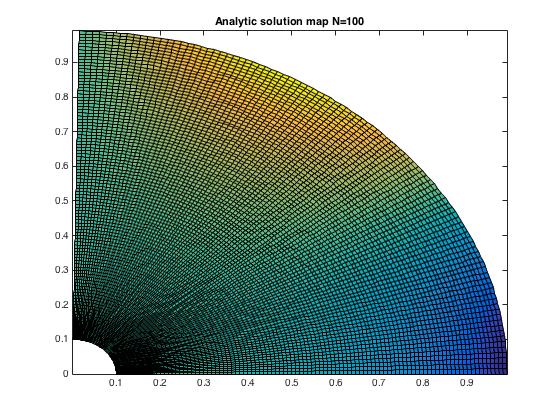
As we can see that the two solution map are essentially identical, and agrees with my sketch. As we can see from our error plot that I think N around 100 is a High N.