

By Colby Gardner
Introduction
The United States Census is written by men and women who’s job it is to accurately and effectively represent the people of the country. This article delves into the details behind the writing of the Census. I seek to explore the actions taken by the Bureau and the actual changes made to the Census form in an attempt to analyze the statistical integrity as well as usefulness of the Census from 1900 to 1980 in reference to the variables for women’s occupation, race, and ancestry. In existing literature, authors have made reference to important adaptations in the census from year to year such as categorization of race or occupation. However, these articles seldom go beyond a short blurb and fail to take a harder look to explore the reasons behind such significant and statistically relevant change. This project investigates the thoughts and ideas of the people who were responsible for writing the census as well as the general surrounding political and pragmatic pressures that impacted their decisions.
The writing of the United States Census takes place behind closed doors in hearings and conversations about what to put into an upcoming census. These hearings provide a explanation of specific processes that went on during the deliberations before the census form for the upcoming decade comes out. While writing the questions that would appear on the next decade’s form, the Census Bureau and governing bodies had hearings describing and debating precisely how to carry out the survey. The parts of these hearings that are of special interest to this project are the conversations about which questions or responses to include in the next form. In The Hearings before the subcommittee on Census and Government Statistics of the Committee on Post Office and Civil Service House of Representatives in 1959, there is a transcript of a conversation in the hearing with Dr. Burgess and Mr. Cunningham about the elimination of income as a question on the 1960 Census and its replacement, mother tongue. In a similar setting, The Hearings Before the Subcommittee on Census and Statistics of the Committee on Post Office and Civil Service House of Representatives in 1967, the speaker talks about new categories for the 1970 Census including mental and physical disability. More specifically to this project,The Hearings Before the Subcommittee on Census and Populations of the Committee on Post Office and Civil Service House of Representatives in 1978 contains deliberations over how to ask a new question of ancestry without overlapping with other questions on the census. In addition to hearings, there have also been sources about the selection of enumerators and surveyors for the Census between the years 1880 and 1940, such as Diana Magnuson’s “The Making of the Modern Census”(1995). It references key steps one had to take on the way to enumerator status, including tests and interviews to insure statistical accuracy (Magnuson, 1995). These enumerators were responsible for the gathering of the data that stood to represent the people, and the directions taught to them effected data all over the country, as seen in women’s occupation in the early 20th century. These individual glimpses into the inner workings of the Census Bureau yield a full image of how the Bureau operated, yet do not supply a statistical source to show the fallout of each of the Bureau’s decisions.
On the flip side of the coin, Census officials are also conscious of who they are polling and the difficulties associated with them. In order to truly understand and critique Census officials, a general picture of the pressures facing the Bureau in this time period is important to understand, as well as the statistical and political change stemming from their decisions. As an essay in Tourangeau’s Hard-to-survey Populations, the writer explains that immigrants are one of the most difficult groups of people to survey as a result of inconsistent housing, uncommon family structures, below average education and income, and a general distrust of society (Massey, 2014). A separate article in the same collection goes on to add that an immigration population is often a linguistic and cultural minority at the bottom of the racial hierarchy of the time (Harkness, 2014). These hard to survey populations match with many of the races the Census Bureau was trying to gather more information about in their racial reorganization from 1900 to 1940 (Hochschild and Powell,2008). Also these variables that contribute to hard to survey populations also share characteristics of the population of Mexican Americans that check “Non Hispanic” in response to the hispanic origin question yet fill in “Mexican” under ancestry (Duncan and Trejo, 2008). ThMassey also shines a light on the repercussions of eliminating parental birthplace from the census in favor of the ancestry variable, describing the time as one which immigration and therefore second generation immigrant populations grew feverishly yet went undocumented (Massey, 2014).
Often times, especially with more recent censuses, there are understandable and logical reasons for dropping important questions. From budgeting the length and expense of a census to just replacing questions with more valuable ones, there is not always a biased or racially fueled reason to change a census that will affect the statistical integrity of the survey (Congress, 1959). Although there is a plethora of material on the creation of the United States Census and how the questions and the process were conducted, there are seldom raw data and analysis to convey some sort of statistical impact that each decision had on the census. In this article I further explore the changes made to each year’s census form as well as the reactions in the data that followed.
Method
To create each of the graphs used in this article, there were a number of methods that were used for all of the visualizations. First, 1% samples from the IPUMS website were taken from every decade of interest in order to form an accurate portrayal of the American population. Second, in order to gather a more interesting data set, Alaska and Hawaii were included in the data sets despite the unavailability of this data in 1940 for the diversity of their populations. For this reason, only the year 1940 in data representations will exclude these states. Lastly, because no sample line variables were used in this data section, the data was weighted with the IPUMS variable PERWT.
In the first figure exhibits a bar graph of women’s occupation by percentage and race. Using IPUMS variable OCC1950, which gives a person’s occupation under the definitions supplied prior to 1950. Lastly, the range of this graph is from census years 1900 to 1940 and are separated into four races; White, Black, Native American, and Asian. No other populations were considered. This visualization is used in this article to show the vast variation in results between the years of 1900 and 1940 when the instructions for enumerators were changing. In this graph, women’s occupation shifts drastically, creating a cause for concern in census taking.
The second figure is another bar graph, this time showing populations of each race recorded by the census at any given year between 1900 and 1940. If a race did not appear on the census in any decade’s form, that race was given a population value of zero for that year. This graph shows the sporatic changes that went on in the categorization of race between 1900 and 1940, bringing attention to these revisions to the census form.
The final figure shows a choropleth map representing the first response for ancestry given in the 1980 and 1990 censuses. Using the IPUMS variable ANCESTR1, the map contains each state’s the most common place of ancestry amongst the state’s population. The Ancestry variable was a new installment in 1980 and data collected from these two years fluctuated greatly, raising concerns about why something that should remain relatively constant should waver so significantly.
Results
In the early twentieth century, the United States was a primarily agriculturally based economy. This meant that many American citizens owned their own farms and worked crops to survive. In this way, it came as no surprise in 1900 when the census category “Farmers and Farm Laborers” made up a significant portion of the summation of all occupations in America. However, more specifically, the share of women farm laborers compared to men was dramatically lower.
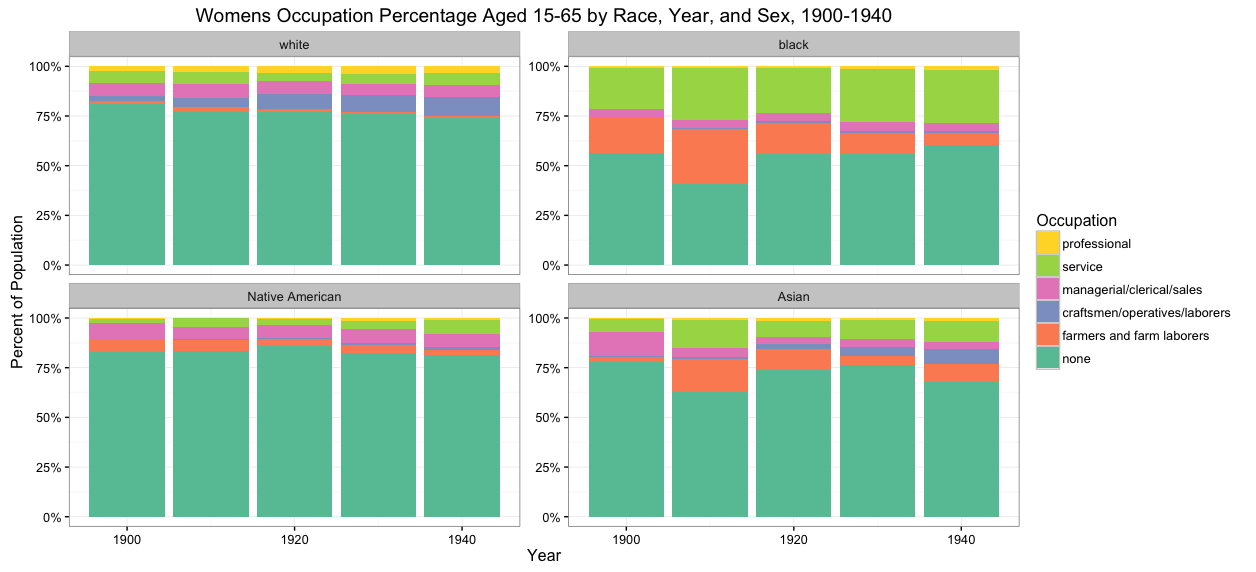
Figure 1 shows a percentage breakdown of women’s occupation
As seen in figure 1, the percentage of women with any occupation at all is quite low throughout the time period in question, but especially prevalent in 1900. This is in part a result of the way enumerators were asking questions about employment. In 1910, a dramatic shift in how the US Census Bureau classified occupation occurred. Prior to this year, questions dubbed as “sorter” or “filter” questions, such as asking whether a person was economically active, caused many people, especially women, to be disqualified from answering any follow up questions about occupation (IPUMS,1999). From 1910 on to 1940, all sorter questions were eliminated from the census and women who were not economically active could answer questions about their occupations (IPUMS,1999). Seen most notably in the graphs for Back and Asian women, a significant spike in percentage of women working as farmers and farm laborers was recorded in the years after 1900. The reason behind this spike specifically in farmers and farm laborers is that, despite not having an employer nor earning a salary, women working on family farms were now considered as having an occupation under this category.
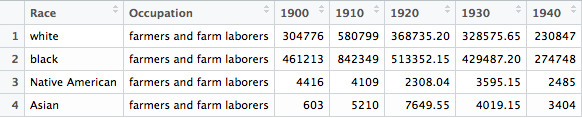
Figure 2 is a bar graph of the number of female farm laborers from 1900 to 1940
In the tabulated form of the bar graph in figure 2 above it is clear that in White, Black, and Asian women, total farm laborers increased at a clip of almost 90% from 1900 to 1910 most commonly resulting from how the US census recorded and understood data entries.
Growing at an alarming rate, the Census Office in Washington D.C. tripled in size every ten years from 1860 to 1880 to reach almost 1,500 employees. 62 marshals and 6,530 assistant marshals took the census in 1870, whereas in 1900 the process of recording each American’s census data had grown so large that 300 supervisors and 53,000 enumerators were required to keep up with the growing population (Anderson, 1988). With the number of employees growing at such an enormous pace, it became increasingly important to train the new enumerators, giving specific instructions as to how to represent the population. In 1910, enumerators around the country were taught specifically in regards to the question of occupation, “An entry should be made in this column for every person enumerated,” with the entry falling in one of three categories, (1) the occupation pursued, (2) an entry of ‘own income’ for persons following no specific occupation but having an independent income upon which they live, or (3) an entry of “none” for persons not falling in either of the two previous categories. Columns 19 and 20 were to be left blank when the entry in 18 was either “own income” or “none” (Enumerator Instructions, 1910). This rhetoric created a monumental shift in women’s occupation, seen in the column graph and table under year 1910, as the Census Bureau replaced the questions from previous years based on economic participation. This shift allowed family farm workers, especially women who worked at home in the fields, to be considered as having occupations in the census form.
Occupation was not the only category in the early twentieth century that was going through an experimental phase. In this time, the political and social landscape of the United States was built upon the hierarchy of race. In this way, the categorization and divvying up of racial and ethnic categories was a source of great interest and effort for Census officials of the time. In the course of 5 census forms and 41 years, the race question saw ten different race categorizations. The category of Black became more complicated, sometimes containing a “Mullato” option in the check boxes. Nationality became increasingly relevant in specifying Asian race, as these categories became more and more detailed. This period stood as a time for experimentation in this section of the census and left no race or ethnicity unaffected. As a result of the constant fluctuation in options, the definitions and demographics of every racial category changed from year to year.
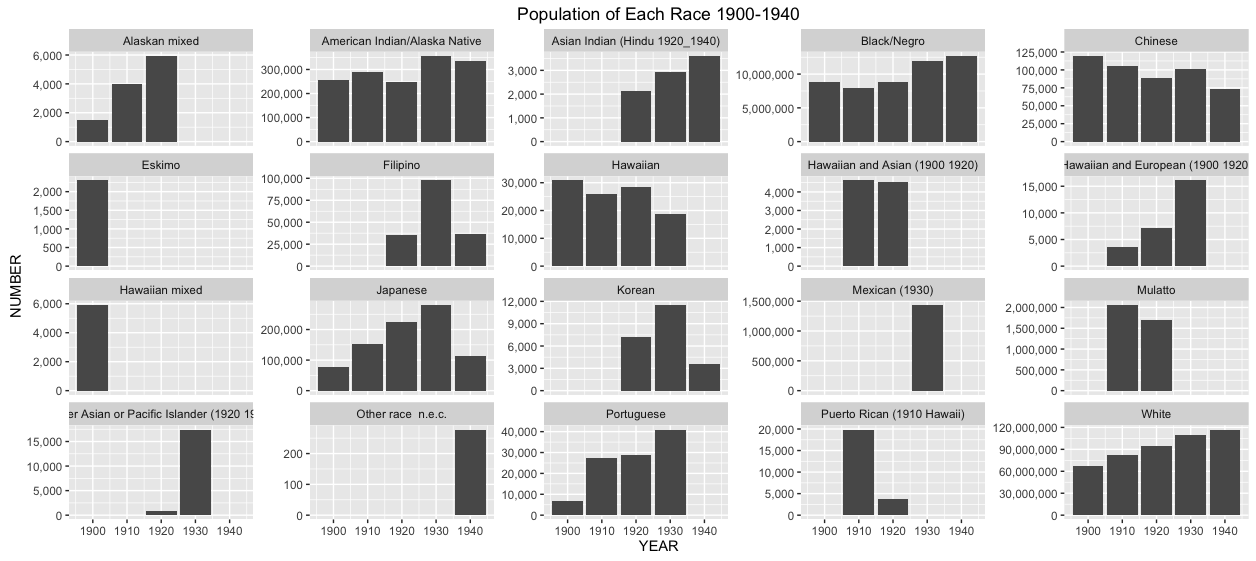
Figure 3 shows every race that appeared on the census between 1900 and 1940
This constant shifting of categories caused individuals answering the census each decade to swing from racial group to group, often never filling out the same box two census forms in a row. This is because for example a person of Mexican heritage would have checked white in census of 1920, but as a result of the addition of Mexican to the census of 1930, would have checked that box in the coming decennial form. The category “Mulatto” was added to the census form in 1850 as a way to separate and count mixed race African Americans, created by men like Josiah Nott, who used the Census to try and prove people of mixed races had lower fertility and shorter lives in order to create racist insurance tables set to overcharge Mulattos (Hochschild and Powell, 2008). In 1900, when Mulatto was omitted from the form, not only did the census lose a category, but the definition of Black now changed from one that used to exclude Mulatto to one that now included the classification. As seen in figure 2, the population of people who checked Black on the census actually went down considerably in 1910 and 1920, as Mulatto reappeared as an option. In 1930, once Mulatto was removed for the last time from the census, the black population jumped to over ten million people. A very similar situation is evident in the category Hawaiian. Between Hawaiian, Hawaiian and Asian, Other Asian or Pacific Islander, and Hawaiian Mixed, which all sporadically appear and reappear between 1900 and 1940, an accurate population trend over the course of more than thirty or forty years in any of these five categories is statistically impossible. With similar experimentation happening throughout the early twentieth century, Census results became inconsistent and increasingly useless in comparing statistics from year to year. As seen most clearly in figure 3 above, most categories that appeared in the census between the years of 1900 and 1940 did not appear on every census for in this time frame, causing several gaps in the bar graphs above. As race categories change, it becomes increasingly difficult to track and compare specific races over time as data is missing whenever the census decided to recategorize. The census set out the experiment with the way they collected data on race in the United States to create a more accurate representation of the population. However, by doing this the Census Bureau simultaneously created a larger problem in the difficulty that came with understanding such widely varying data.
The introduction of Mexican as a category on the 1930 census was met with great opposition from a Mexican population wary of racial discrimination based on the new census separation between whites and Hispanics. The deputy director of the census in 1930 once wrote that “if the Mexicans in this country could be convinced of the value of the census work and of the impossibility of the information they give being used against them, I believe we could secure their hearty cooperation” (Hochschild and Powell, 2008). Unfortunately, many people did not recognize the change for its scientific accuracy and instead saw it as a way to discriminate. Mauro Machado, an associate of the Mexican civil rights activist Alonso S. Perales, described the attempt to document the Mexican American population as “the cowardly way in which [Box Committee witnesses] try to make us possessors of negro blood” (Graton and Merchant, 2016). As a result of these political and social pressures, the Census Bureau never again listed Mexican as a race after 1930, despite its statistical relevance.
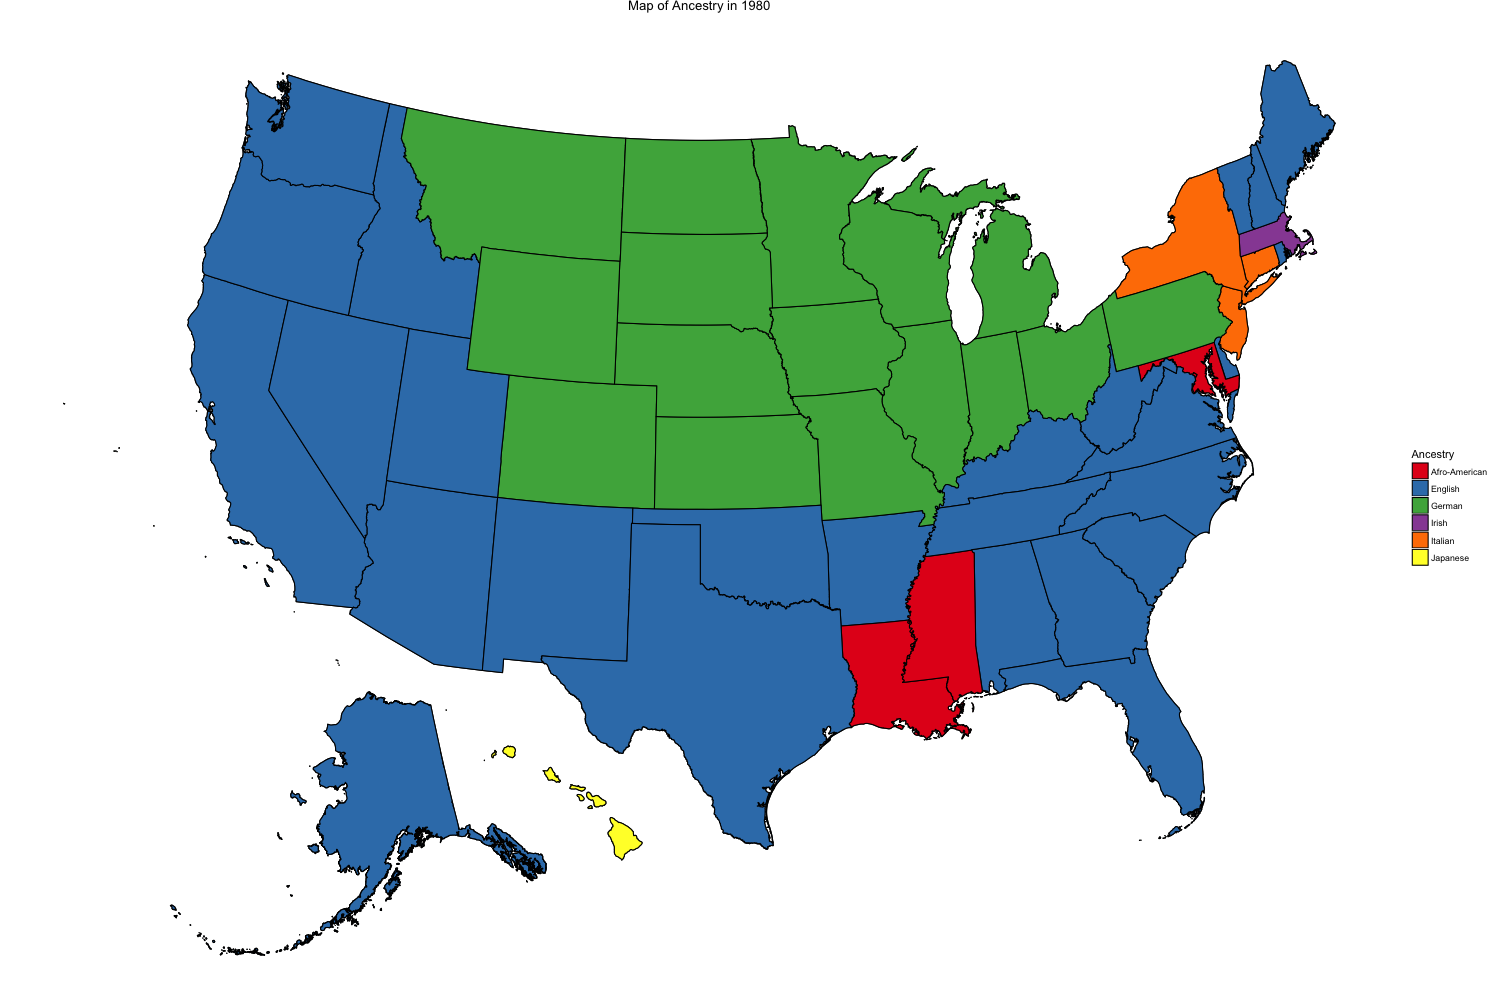
Figure 4 shows the most common ancestry response in each of the 50 states in 1980
In addition to research on race and ethnicity, the Census Bureau added an open ended entry in the 1980 census form to collect information on ancestry. This addition came as an effort to grasp a better understanding of the nationality and background of people answering the census.In previous years, asking for the country of birth for an individual’s mother and father in order to find a person’s lineage only worked if the individual was a second generation immigrant. The question of ancestry replaced these questions and gathered data no matter how many generations removed from their nation of origin a person was (Rosenwaike, 2002). The Census Bureau asked the question of ancestry in the hopes that it would replace the parents birthplace question, identify people of Hispanic origin by gathering information about their ethnic origin, and gain information on the ethnicity of the other part of the population (Farley, 1990).
Figure 4 shows the most common ancestry response in each of the 50 states in 1980
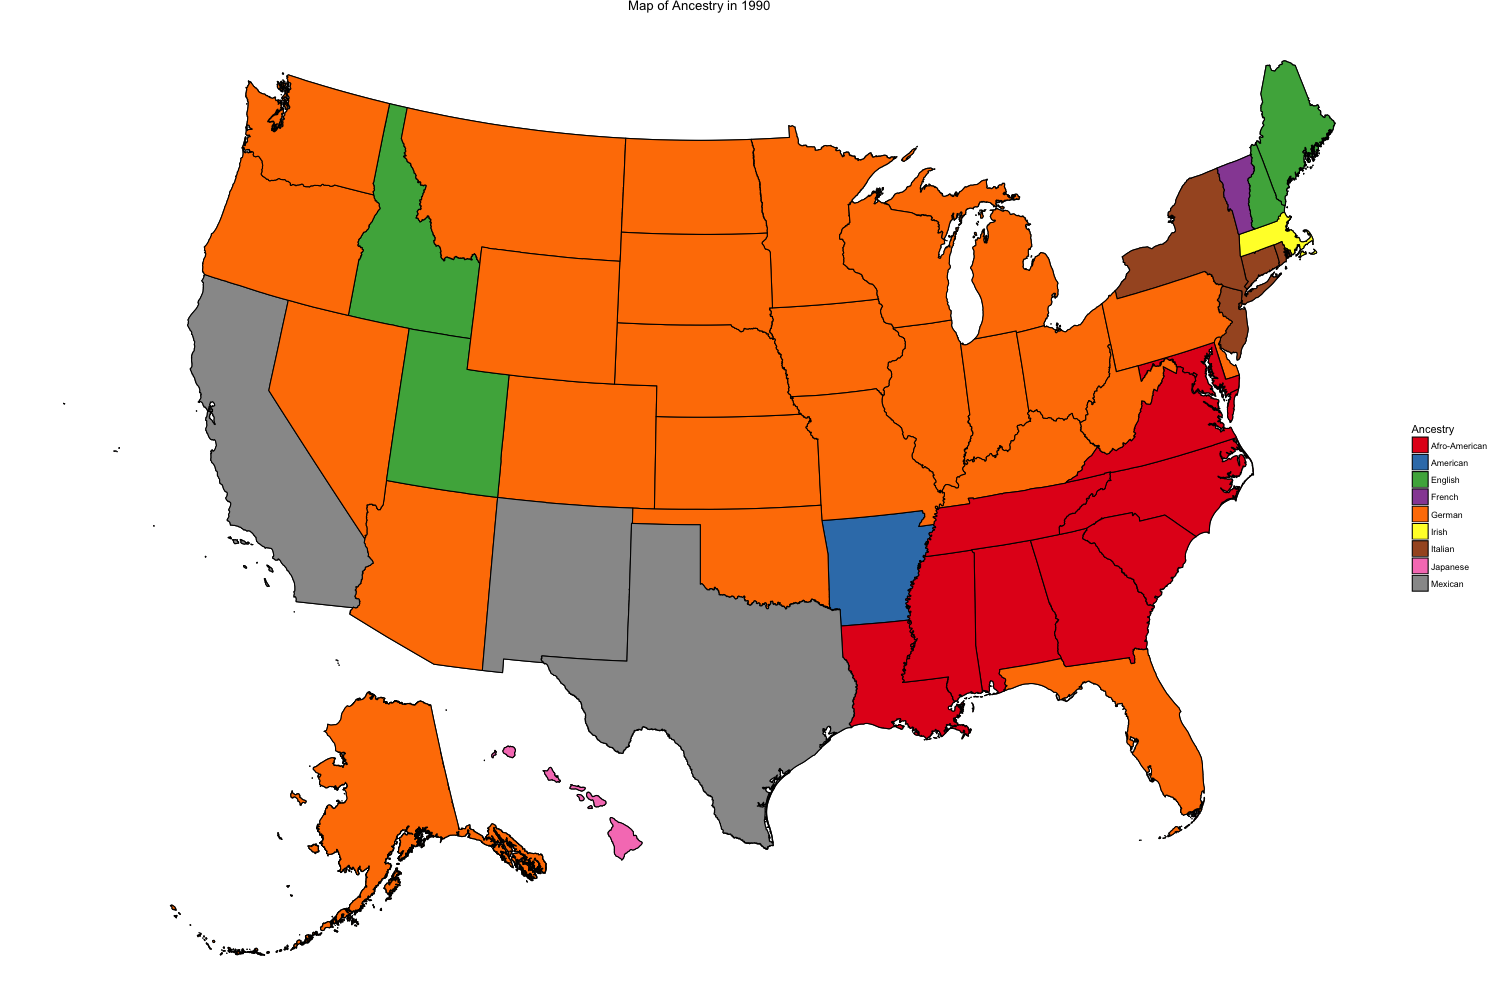
Figure 5 shows the most common ancestry response in each of the 50 states in 1990
Figure 4 and 5 above are choropleth maps of the United States showing the most common ancestry for each of the 50 states. In 1980, the most common ancestry throughout the United states was English, spreading throughout every corner of the country from Oregon and the entire west coast to Florida up to Maine. The next most common ancestry spanning the northern Midwest was German, ranging from Idaho all the way East to Ohio and Pennsylvania. The other most common ancestries were Italian, Afro-American, Irish, and Japanese. In 1990 however, English as an ancestry shrank to the most common entry in just 4 states as German became far and above the most overwhelming ancestry in America. Afro-American also became much more common as many southern states top entry. Other entries in this census included Mexican, which showed up in most states bordering with Mexico including California, New Mexico, and Texas; French; American; Italian; Irish; and Japanese.

Figure 6 shows the ancestry question in the 1980 census
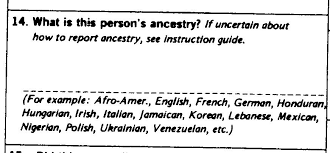
figure 7 shows the ancestry question in 1990
A reason for such a dramatic shift in Ancestry in just 10 years could have been the way the census asked the questions from year to year. Above in Figures 6 and 7 are the census questions about ancestry in each form from 1980 to 1990. In 1980, 16 ancestries appeared on the census as suggestions. In 1990, 21 ethnic groups for ancestry were specified as options for the open ended question. Out of the 16 suggestions in 1980, three groups, English, French, and Hungarian, did not appear on the list in 1990. All three of these groups experienced significant declines in the number of persons reported in each group. This decline in English ancestry is the primary reason behind the stark contrast between maps from 1980 and 1990 above. From 1980 to 1990, English ancestry dropped 32%, French ancestry dropped 28%, and Hungarian ancestry dropped 20%, all because of their omission from the suggested categories under the open ended question (Rosenwaike, 2002). The two groups that moved up the farthest on the list between the two census forms were German and Italian. Between the two censuses, the number of people who answered having German ancestry increased 6% while Italian ancestry increased 8.5% (Rosenwaike, 2002). When writing the census in the 1970s, the Census Bureau actually had trouble deciding how to include the new question on ancestry. In a hearing about the upcoming census in 1978 Mr. Lehman said, “I am still bothered by the double question on the 100 percent form that deals with when you want to talk about ethnic origin, heritage, ancestry, and race. I think if you are not awfully careful with that question, it would be so counterproductive” (Hearing before the Subcommittee on Census and Population, 1978). Although they were able to create a productive question for the census of 1980, it was the slight change in wording in the next decennial census that created a counterproductive swing in the data.
Conclusion
This Article explores the process of creating the United States Census. We looked at women’s occupation in the early 20th century and how enumeration techniques varying year to year could influence the results of each year’s occupation count. In 1910, when enumerators were directed not to ask filter questions ensuring that all workers were economically active, women with occupations skyrocketed, especially those working on family farms as farm laborers. Race from 1900 to 1940 was also studied, as race categories like Asian or Black where split into finer and finer subcategories, each time making the statistics less and less consistent and therefore harder to analyze. Finally, the new ancestry category of 1980 and 1990 was put under the spotlight. Although English ancestry was the most common ancestry in America in 1980, its removal from the suggested entries in 1990 form caused a massive amount of people to write something that was suggested, and English ancestry was replaced my German ancestry as the most repeated answer. In each of these cases, whether it be the way a question on the census form was asked or the way enumerators recorded their data, they all prove that the Census Bureau wields tremendous power over how the United States population is represented. All it takes is changing the order of a list or changing the name of one category and the entire country’s makeup looks different. The job of the United States Census is to create data that represents the people. In this way, the men and women responsible for the administration and interpretation of the census serve as a bridge between people and statistics and even the smallest adjustment of words could lead to the misrepresentation of the American people.
Works Cited
Hearings before the subcommittee on Census and Government Statistics of the Committee on Post Office and Civil Service House of Representatives. April 8, 1959 http://congressional.proquest.com/congressional/result/pqpresultpage.gispdfhitspanel.pdflink/$2fapp-bin$2fgis-hearing$2f4$2f3$2fb$2f4$2fhrg-1959-poh-0007_from_1_to_49.pdf/entitlementkeys=1234%7Capp-gis%7Chearing%7Chrg-1959-poh-0007
Hearings Before the Subcommittee on Census and Statistics of the Committee on Post Office and Civil Service House of Representatives. May 23, 1967 http://congressional.proquest.com/congressional/result/pqpresultpage.gispdfhitspanel.pdflink/$2fapp-bin$2fgis-hearing$2f3$2ff$2f7$2fa$2fhrg-1967-poh-0015_from_1_to_179.pdf/entitlementkeys=1234%7Capp-gis%7Chearing%7Chrg-1967-poh-0015
Hearings before the subcommittee on Census and Population of the Committee on Post Office and Civil Service House of Representatives. March 21, 1978 http://congressional.proquest.com/congressional/result/pqpresultpage.gispdfhitspanel.pdflink/$2fapp-bin$2fgis-hearing$2ff$2fb$2fd$2fc$2fhrg-1978-poh-0020_from_1_to_68.pdf/entitlementkeys=1234%7Capp-gis%7Chearing%7Chrg-1978-poh-0020
“1910 Census: Instructions to Enumerators”: Extract from Enumeration Forms on IPUMS https://usa.ipums.org/usa/voliii/inst1910.shtml
Duncan and Trejo. “Ancestry versus Ethnicity: The Complexity and Selectivity of Mexican Identification in the United States”, 2008.
Farley, Reynolds. “Race and ethnicity in the US census: An evaluation of the 1980 ancestry question.” Report prepared from research conducted as American Statistical Association National Science Foundation/Bureau of the Census Fellow. University of Michigan (1990).
Hochschild and Powell. “Racial Reorganization and the United States Census 1850–1930: Mulattoes, Half-Breeds, Mixed Parentage, Hindoos, and the Mexican Race”, 2008.
Magnuson, Diana L. https://usa.ipums.org/usa/voliii/enumproc1.shtml, “The Making of a Modern Census: the United States Census of Population, 1790-1940,” Ph.D. dissertation, University of Minnesota, 1995.
Merchant and Gratton. “La Raza: Mexicans in the United States Census”, 2016
Rosenwaike, Ira. https://gateway.dartmouth.edu/science/article/pii/,DanaInfo “Ancestry in the United States Census, 1980-1990″, 2002.
Tourangeau, Roger. 2014. Hard-to-survey populations. Harkness. 2014. Surveying Cultural Linguistic Minorities; Hard-to-survey populations. Massey. . 2014. Challenges to Surveying Immigrants; Hard-to-survey populations.
Code for my graphs can be found at
https://github.com/wcolbygardner/QSS-30.50/blob/master/Final%20Project/finaldsf.R