

For this investigation, I decided to explore the number of intercensal births within a household by the number of immigrants leading that household. For my purposes, the leaders of a household are defined as the householder and his or her spouse.
Choices and trends in fertility have historically depended on both cultural attitudes and economic needs. Acknowledging that first-generation immigrants often differ from the average native-born American in these areas as a result of upbringing and the unique pressures they face in America, I decided to investigate the number of intercensal births within immigrant and non-immigrant households from 1900-1950, with the hope that some of these differences would be reflected in the resulting data.
I decided to use both the immigration status of both the householder and his or her spouse due to the problematic nature of the householder designation (Smith 1992, 422). The census has historically done a poor job defining this designation, or keeping it consistent from year to year. In some years, women were barred from being the household head. In others, enumerators were instructed to use a woman’s husband if she claimed to be the household head. Smith (1992, 430) speaks of a time in earlier history when the title had real meaning. Before women had the right of personhood and standing under the law, the head of her household (i.e. father, then husband) would be accountable for her actions. With this archaic mechanism gone by the 1900s, it makes little sense to limit our analysis to just householders.
Data and methodology
I turned to the Integrated Public-Use Microdata Series, using census samples from 1900 through 1950. I used the 1% sample provided by IPUMS for each year studied. Before any further stratification, I filtered to only include individuals in regular households (that is, individuals not living in group quarters).
After this, I labelled household heads and their spouses by immigration status (foreign born or not) and created an indicator variable for all children born within the previous intercensal period (i.e. those less than ten years of age). This definition of child allows me to avoid counting the same child in two census years and allows me to draw more accurately proxy for fertility within a given intercensal period. No attempt was made to determine biological linkage through the relate variable; this information is not relevant to the question at hand. Rephrasing the question to include only biological children would leave me with no way account for foster children, adopted children, stepchildren, and young relatives.
With that in mind, it should be noted that many of the households we will find with a large number of children will be in this scenario due to cohabitation of multiple families in a single house. Hareven (1974, 325) discusses some of the difficulties with distinguishing between family structure from habitation arrangement. In this respect, concerns about the increasing prevalence of “broken homes” do not always consider the reasons behind a parent living elsewhere (ibid.).
The immigration status dummy variable was aggregated by household as was the child dummy variable. As a result, I was able to stratify the population of children by the number of children that they lived with, and how many householder/spouses in that child’s household were first generation immigrants. This analysis was performed at the individual (i.e. how many children live with x-many other children) and household (i.e. how many households have x-many children) level.
The trends within and across years were clear and striking. Although the individual-level analysis is biased in proportion with the number of children in a household, this effect was not significant in my analysis. The reason is that much the bias it is cancelled out when one considers the proportion of children/households of a certain criteria rather than an absolute count (where the multiplicative nature of the bias would be apparent). The investigation confirms this by noting the general lack of distinction between Figures 1-3 and Figures 4-6.
Results
I begin by considering the earliest census in the dataset. As is clear (in Figure 1), the proportion of children in each cohort that lives in a one-immigrant household is fixed (at about ~15%) for most of household size configurations. This number is identical to the proportion of children without any compatriots in two-immigrant households. Nevertheless, I find that the proportion of children in two immigrant households steadily increases to ~30% when I consider the 8 child household configuration. This concentration comes at the expense of the proportion of no-immigrant households with a large number of children. One might speculate that additional children are more desirable to two-immigrant households as a result of attitudes from their home countries. However, I find that at the extreme (9 children or more), only no-immigrant households are represented. Given the low total number of children living in these configurations, it may be possible that this phenomenon is the result of fundamentalist religious doctrine.

Figure 1.
By 1950, I see that the landscape has shifted dramatically. Through the 8 child configuration, native born households dominate, increasing their share at every tier (Figure 2). Unsurprisingly, I can recall the effects of the baby boom. Having children the post-war days was more convenient, fashionable, and encouraged. This economically prosperous time meant that soldiers returning from WWII could worry less about the cost of child rearing and weigh its benefits more heavily.
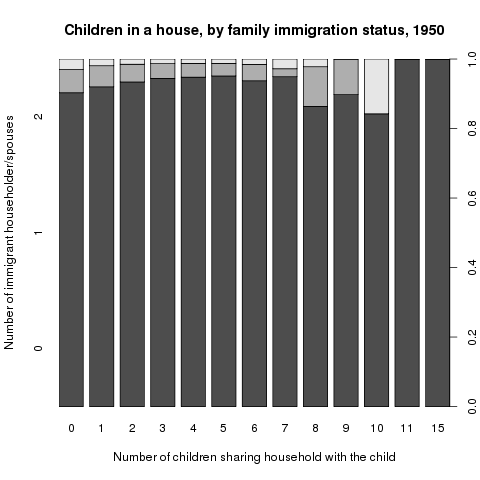
Figure 2.
In searching for the point of inflection between there two contrasting trends, I can consider the children born in the 1920’s (Figure 3). In the first five configurations, the proportion barely change by immigration status. Children living in immigrant households account for approximately 10% of children within their configuration cohort. The uptick I see in the proportion of children living in non-immigrant households in the higher configurations does not appear to conflict with the overarching trend.
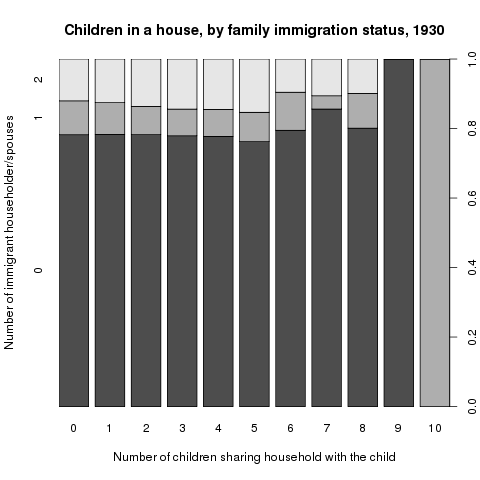
Figure 3.
Household-level results
As mentioned, I can compare the above results to an analysis at the household level. That is to say, I may choose to consider the proportion of households in any configuration cohort. My use of proportion means that I will did not expect to see any bias in my initial analyses and thus any subsequent analyses at the household level should be fairly consistent. Doing this analysis at the household level also allows me to consider homes without any children. In my previous charts, this configuration is unaccounted for because there is no child present to experience it.
Turning to Figure 4, I find few notable differences between the comparable categories in this figure and Figure 1. One discontinuity worth noting is the higher proportion of one-immigrant households with no children. Perhaps this group includes a significant portion of young and recent immigrants beginning their families. Nevertheless, this anomaly does not effect the overall trend observed.
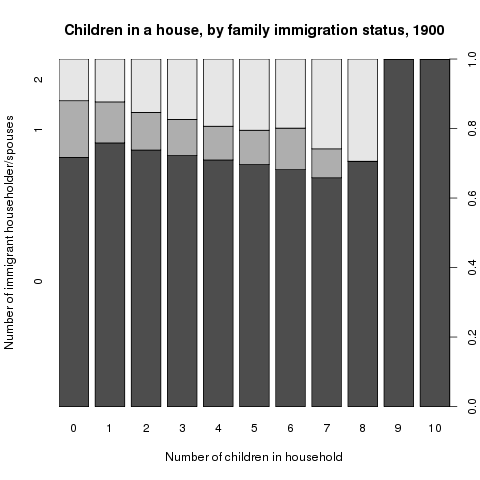
Figure 4.
The second chart (Figure 5) is remarkably similar. Admittedly, many subtle differences between 2 and 4 are likely lost to the overwhelming visual effect of the baby boom. Nevertheless, there is little worth noting here.

Figure 5.
Figure 6 leaves me in a very similar situation. Controlling for absolute size by using proportions allowed me to eliminate virtually all distinctions between my personal and individual level analyses. 1930 still marks the inflection point in trends, with great similarity across child count configuration cohorts.
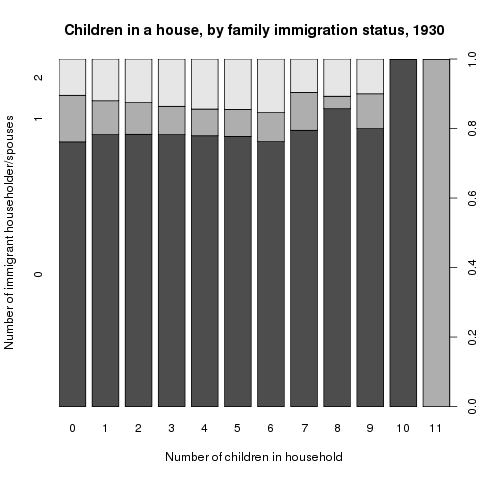
Figure 6.
In order to obtain a better sense of the size of each cohort, and the relative dearth of households with more than two children, I chose to visualize the data in through a mosaic plot. The area of each rectangle in a mosaic plot is proportional to the number of observations represented by that cohort. Looking at the year 1900, I limited the dataset to households with no more than seven children and plotted the information in Figure 7.
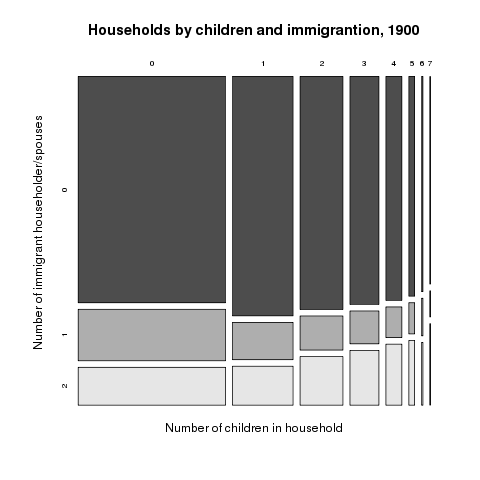
Figure 7.
This figure really helps put many of the trends I had observed earlier into perspective. Although there were patterns worth observing in families with many children, these patterns only really describe what is going on in a small minority of households.
Conclusion
As per predictions, there were notable trends in the number of children born in immigrant households between censuses. The fact that these trends shifted from decade to decade implied that the attitude towards children in America, among non-immigrants changes quickly and dramatically. The rise of the nuclear family, which coincided with the Baby Boom, is one example of a recent trend largely resulting from example of this from recent US history, and is likely driving the inversion in trend that we see between 1900 and 1950.
Sources
Source code for visualizations
Hareven, Tamara K. “The Family as Process: The Historical Study of the Family Cycle”, Journal of Social History, Spring 1974; Vol. 7, No. 3: 322-329. Print.
Ruggles, Steven. “Family Interrelationships”, Historical Methods, Winter 1995; 28(1): 52-58. Print.
Smith, Daniel Scott. “The Meanings of Family and Household: Change and Continuity in the Mirror of the American Census”, Population and Development Review, Sep. 1992; Vol. 18, No. 3: 421-456. Print.