

Introduction
The 1st and 2nd Great Migration are known as the two instances where African-Americans migrated from the South to other regions of the United States. The 1st Great Migration provided an unprecedented opportunity for African-Americans living in the South – the ability to finally escape agrarian employment by obtaining industrial employment from a skyrocketing demand for military products to assist the United States and the Allied forces in World War I (Grossman 1989, 13). Although given this opportunity initially in the 1st Great Migration, between 1910 and 1920, about 430,000 African-Americans left the South (Gregory 2005, 15). A surprisingly low number for a new “lease-on-life.” The 2nd Great Migration, which was fueled by the more technologically advanced World War II, once again provided African-Americans with an opportunity to further the southern diaspora movement. With more economic opportunities as a result of the country still recovering from the after effects of the Great Depression, about 1.45 million African-Americans escaped their suppressive state in the South for a better life in the North and West (Ibid, 13).
Although these massive migrations are seen as major events in African-American history, a new movement has occurred since the 1970s. Labeled as the New Great Migration, African-Americans have begun to migrate to the South since the beginning of the 1970s. As William Frey note, “the region’s economic, amenity, and cultural ‘pull’ factors now outweigh the ‘push’ factors that predominated in past decades” (Frey 2004, 2). The two primary research question presented in this report is: What are the primary explanations that influenced African-Americans to return to the South, an area that is historically tied to the oppression and commoditization of African-Americans? Furthermore, what is the demographic make-up of African-Americans participating in the New Great Migration?
The 1940s
My research begins with 1940 as World War II, although not directly affecting the United States yet, still had an impact on the country and the migration within it. With the collapse and annexation of France to Germany and Great Britain being the remaining European stronghold for the Allied forces, Franklin D. Roosevelt declared the United States the “Arsenal of Democracy” (Charles 2013,16). Although FDR requested manufacturing firms to allocate a portion of their resources to the production of military vehicles and weaponry for Great Britain, it took until December 29, 1940 for his wishes to materialize. In a fireside chat, FDR to appealed directly to the American people by asking them to work together and construct military products to “enable [Great Britain] to fight for their liberty and for [America’s] security” (Ibid, 16). With the U.S. government establishing manufacturing plants in the North and West, primarily along the California coast, the 2nd Great Migration began as African-Americans saw more economic opportunities for themselves. Initially, African-Americans could not freely be employed in these manufacturing jobs. However, with the growing pressure from A. Phillip Randolph and his growing March on Washington Movement to protest against racial injustice in industrial employment, FDR passed Executive Order 8802 to “reaffirm the policy of the United States that there shall be no discrimination in the employment of workers in defense industries or government because of race, creed, color, or national origin” (Executive Order 8802 – Prohibition of Discrimination in the Defense Industry). This officially opened the door for African-Americans to work in manufacturing jobs.
The 1950s & 1960s
With the end of the war effort, a large portion of American society was flourishing, including the South. When it comes to public investments for manufacturing, the percentage of military contracts awarded to the South as a total of all military contracts issued in the country rose from 7.6% in 1951 to 23.5% in 1967 (Schulman 1991, 141). Overall when looking at manufacturing and service sector jobs, from February 1961 to October 1967, non-farm payroll, in 10 southern states were higher than the national average (Nelson 1968). This would appear promising for those African-Americans still living in the South, especially since African-Americans began to have heavy concentrations of employed individuals working in the manufacturing industry (Hunt et.al 2013). However, African-Americans were still ostracized from mainstream society from an economic standpoint. Wage inequality was high between whites and African-Americans as whites were claiming all the new, desirable jobs in the South (Schulman 1991, 178). In 1949 and 1969, on average, African-American males living in the South earned less than white males still living in the South, $1,415 and $5,036 vs. $2,850 and $9,575 respectively for both, (Gregory, 2005, 352-353). Although African-Americans that migrated out of the South were still making less than their white counterparts, whether they were living in the south or non-south, other social and economical factors encourage them to move.
One such economic factor to encourage people to migrate was educational attainment. Overall, educational opportunities, and therefore achievement, for African-Americans were still low, which further intensified the lack to obtain upward mobility. Nevertheless, education attainment was better for African-Americans in the North and West than in the South. In 1960, only 27% of African-Americans between the ages of 25-34 graduated high school in the South. Of the 25-34 year old African-American population, the median number of school years completed was 9.3 (Allen 1986, 291). In the North and West, 41% of African-Americans between the ages of 25-34 graduated high school and the median number of school years completed for the this portion of the population was 11.2. With a greater chance of obtaining a high school degree and meeting the basic requirements of being employable in jobs outside the agrarian industry, African-Americans could not deny the benefits of living outside the South.
A social factor that influenced the continued migration of African-Americans was racial discrimination and terrorization of African-Americans by whites still widely persisted in the South compared to the rest of the United States. The Supreme Court case Brown v. Board of Education (1954), found it illegal to continue the separate, but equal doctrine in U.S. society. The North and West, though these regions had their own issues, made progress towards integration within schools and in other social arenas of their communities. The South, however, did not progress as quickly. Additionally, the Civil Rights Movement’s achievement of the Civil Rights Act of 1964 and the Voting Rights Act of 1965 were faced with pushback from state governments in the South that ultimately required direct federal oversight and protection to be enacted. Finally, African-Americans still faced being attacked or even lynched by whites for trivial incidences or false reports of harassment or attacks. Ultimately, the 1950s saw more than 1.5 million African-Americans leave the South, which was nearly 10% of the total African-American population in the country (Price-Spartlen 2008, 438). About 813,000 African-Americans left the South in the 1960s (Gregory, 2005, 15).
Data and Methods
The data utilized for this project is from the Minnesota Population Center’s Integrated Public Use Microdata Series (IPUMS) hosted at the University of Minnesota. 1% samples were used from 1940, 1990, and 2000.The years 1970 and 1980 used 1% state fm1 and 1% metro data samples respectively. The year 1950 was excluded from my data, as the 5-year migration question (MIGPLAC5) was not available and only the 1-year migration question (MIGPLAC1) was used for the 1950 Census. For 1960, a 5% sample was used, which equates to a 1/5 of the amount of people sampled in a 1% sample, as MIGPLAC5 is not available for the 1% sample. As for defining what states were considered to be apart of the South, I used the region designation created by IPUMS. All data is weighted by PERWT. The sixteen states and areas in the South are Alabama, Arkansas, Delaware, District of Columbia, Florida, Georgia, Kentucky, Louisiana, Maryland, Mississippi, North Carolina, Oklahoma, South Carolina, Tennessee, Texas, Virginia, and West Virginia. Code to generate the following visualizations is available here.
This project focuses on the African-American population who were living in the South at the time of the census being administered. All data is collected from the African-American population in relation to where they lived five years ago. To represent my data, six visualizations are provided in the results section. Figure 1 is an animated map displaying the birthplace of African-Americans migrating to the South. Figure 2 is a bar graph of the whether an African-American was born in a Southern or non-southern state. Figure 3 is a population pyramid showing only Southern-born African-Americans returning to the South. Figure 4 is a bar graph of the African-American population migrating to the South five years previously as a household. A household is defined by the 1970 definition established by IPUMS. Furthermore, those who were living alone in a household five years ago, they are designated as single, while everyone else is designated as a family. Figure 5 is a further progression of Figure 4, where a bar graph displays the number of households designated as family do or do not have children. A child is defined as an individual that is from 0-18 years old. Figure 6 is a bar graph of the educational attainment of African-Americans migrating to the South. The levels of educational attainment, which were determined by the various labels in the detailed educational attainment variable (EDUCD), are defined as: Less than high school (N/a or no schooling, nursery school/preschool, and grades 1-11), High school diploma or GED (Grade 12, high school graduate/GED, and high school diploma, GED), Some College (Less than 1 year, 1-8 years of college, and Associate Degree), Bachelor Degree, and Advanced Degree (Master’s Degree, Professional degree beyond a bachelor’s degree, and doctoral degree).
Results

Figure 1. The Birthplace of African-Americans Moving to the South, 1940, 1960-2000.
Beginning in the 1970s, a new trend was arising for African-Americans in our society. For the first time, more African-Americans were willingly migrating to the South from the Northern and Western areas of the United States. Figure 1 shows that Southern-born individuals were most likely to return to the South. In 1940 and 1960, people born in the Northern states were migrating to the South at a similar, yet lower, rate than Southern-born individuals. The 1940 Census reported that in 1935, surprisingly, the African-Americans who were returning to the South were primarily Southern-born, however, they totaled no more than 1,000 individuals. For the 1960 Census, Southern-born individuals once again migrated to the South in totals between 1,000 and 4,499 people per state for 1955. Of the 11 states, having at least 1,000 African-Americans migrate, two were Northern states: New York and Pennsylvania. In 1965, six more states had at least 1,000 native-born individuals move to the South: two in the south (Florida and Arkansas) and four non-southern states (California, New Jersey, Ohio, and Illinois).
By 1970, African-Americans whose birthplace were either in Alabama, Georgia, Mississippi, North Carolina, South Carolina, or Texas were moving disproportionately into the South. In 1980, the birthplace demographics stayed the same; except for New York becoming the leading state with loses for native-born African-Americans. , To provide further context, New York topped the ranking in the 1975-80 period with a lost of 128,143 people (Frey 2004 3). In 1990 and 2000, the Texas, Georgia, Alabama, and North Carolina were the only southern states to consistently have more than 20,000 native-born people return to the south. Additionally, in 2000, non-southern states (California, Illinois, Michigan, New York, New Jersey, and Ohio) outpaced the southern states in migration into the South. When excluding California, these states experienced intensifying loses of manufacturing in the area now known as the Rust Belt.
Besides the gains from specific states for their native-born African-American population, it is important to analyze the actual loses of African-Americans in each state For example, from the 1965-70 period, Georgia lost 23,363 African-Americans, leading the state to be ranked seventh in the rankings for states with the largest losses of African-Americans (Frey 2004, 3). Surprisingly, during the 1975-80 period, Georgia jumped to fourth in the rankings in states with the largest gains in African-American population by adding 29,616 people (Ibid, 3). South Carolina and North Carolina experienced a similar trend with going from a negative net migration in the 1965-70 period and being in the top ten states losing African-Americans to being in the top ten states experiencing an increase in their African-American population ten years later. In 1980, Illinois, Ohio, and New Jersey joined New York as states that began to lose a disproportional amount of native-born African-Americans. In the 1975-80 period, they were ranked 3rd, 6th, and 10th respectively (Ibid 3). In 2000, only three southern states (Kentucky, Oklahoma, and West Virginia) did not have a disproportionate amount of people return to a southern state. This may be due to the fact that Oklahoma borders the Midwestern states and West Virginia and Kentucky border northern states, so their social environment may have not been as oppressive as the “Deep South.” As for non-southern states in 2000, Missouri, Indiana, and Michigan joined the trend to lose large populations of African-Americans.
When analyzing this migration of native-born people, California is an interesting case. In the 1965-70 and 1975-80 period, California was the leading state adding African-Americans to their population with 91,425 and 75,746 people respectively (Ibid 3). From the 1985-90 period, California dropped to sixth in the rankings by adding only 21,636 African-Americans. Though it was inevitable that California was going to begin to see a decline in African-American, surprisingly, California jumped to second for in a declining African-American population in the 1995-2000 period with a loss of 63,180 people. The primary reason cited for the out-migration from California, in general, is the high cost of living in the state (Ibid, 10).

Figure 2. The Number of African-Americans Born in a Southern or Non-Southern State Migrating to the South, 1940, 1960-2000.
Continuing with the birthplace of African-American individuals that were migrating to the South, Figure 2 displays, based on regional terms rather than including subsets information on individual states, that African-Americans born in the south were the majority of African-Americans migrating to the South. In 1970, the main demographic of African-Americans migrating to the South, were southern-born (66%) than non-southern-born (34%) (Larry L. Hunt, Matthew O. Hunt and William W. Falk 2008, 99). This trend continued until 1990 when non-southern-born African-Americans became the primary group migrating to the South (Ibid). The cause for this is the demographic of African-Americans returning to the South were the children of those individuals participating in the 2nd Great Migration (Richardson 2011, 26).

Figure 3. The Population Pyramids for Southern-born African-Americans Migrating Back to the South, 1940, 1960-2000.
As the majority of people initially moving back to the South were the children of migrants in the 2nd Great Migration who were more than likely born in the South them, the average age of migrants would be expected to be younger. This belief holds partially true, as the average age of individuals migrating to the South was 33.5 in 1970 (Larry L. Hunt, Matthew O. Hunt and William W. Falk 2008, 108). From the 1970 Census, those individuals who identified as being born in the South, lived in the North five years ago from the year they reported in that year’s census and resided in the South at before the 1970 Census was administered (SNS), the typical age for migrants was 38 (Ibid, 108). However, for people born in the North, lived in the north five years ago, and currently reside in the South as of 1970 (NNS), their age was even younger at 29 (Ibid, 108). As mentioned before, this may be due to the discrepancy in educational opportunities and quality, which determines overall attainment for children. This assertion will be further discussed in Figure 6. Additionally, it may be due to the fact that young NNS individuals see the South as a region of opportunity just like the older SNS African-American population.
Moreover, what is interesting is that the age of NNS individuals appears to be an anomaly when comparing to white individuals. In 1970, white NNS and SNS individuals were both 38 years old. One would expect white NNS individuals to be a similar age as African-American NNS individuals (Ibid, 108). When looking at the 2000 Census, white NNS and SNS individuals were 43 and 42 years old respectively and African-American SNS individuals were 44 years old. African-American NNS individuals still only had a median age of 34. This brings about question what attracted so many younger, African-American NNS individuals.
Additionally, the proportion of African-Americans coming to the South based upon sex has changed as well. When analyzing each age group, African-American males in the 10-19 and 20-29 age groups outnumbered their African-American women counterparts in from as reported from the 1960-1980 censuses. This can be tied to the drastic change in economic opportunities available in the South becoming apparent at the time. A plurality of African-American men (39%) reported in a survey that they migrated to the South for economic opportunities (Hunt et. al 2013). However in the 1990 Census, the disparity levels between the sexes dropped, especially in the individuals in the 10-19 age range. A potential reason for this is the War on Drugs, which was instituted in 1971 under Richard Nixon. A former Nixon advisor admitted that one of the Nixon’s administration’s biggest enemies was African-Americans. . As he admitted, “By getting the public to associate…blacks with heroin, and then criminalizing [heroin] heavily, we could disrupt those communities…. Did we know we were lying about the drugs? Of course we did” (Baum 2016). As a result of the enactment of tougher recreational drug laws, African-American males were being arrested at high rates. Nevertheless, as larger African-American populations were being established throughout the South, after 1990, a majority of African-Americans migrating from non-southern states were women. A plurality of women (43%) moved to the South for familial connections.
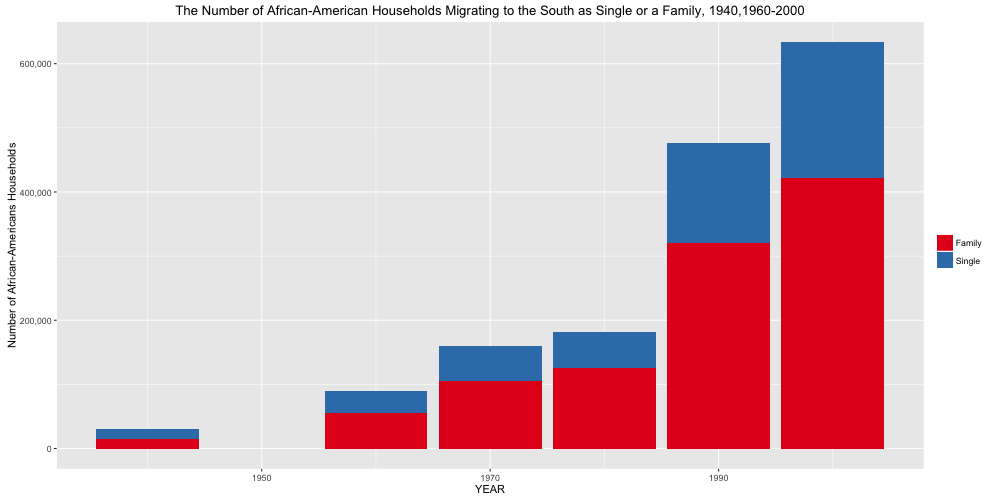
Figure 4. The Number of African-American Households Migrating to the South as Single or a Family, 1940, 1960-2000.

Figure 5. : The Number of African-Americans Families Moving to the South With or Without Children, 1940, 1960-2000.
Historically, the U.S. has had its migrations characterized by the movement of an entire family unit, which is still applicable to the New Great Migration. As shown in Figure 4, besides, 1940, the New Great Migration has a majority of African-American individuals migrating to the South with family members. Figure 4 is not constrained to only display family units including a husband and wife, but includes any individual migrating and now living with a person they identify as family. Such combinations include a single parent and their child, multiple siblings, and extended relatives living with each other.
When analyzing marriage rates in the African-American community in 1970, the about 49% of African-Americans who were NNS and SNS were married. At the same time, 16% of SNS and 35% of NNS individuals never married (Larry L. Hunt, Matthew O. Hunt and William W. Falk 2008, 108). However, in 2000, the average percent of NNS and SNS individuals being married was about 36%, while the number of people never married was 41% for NNS and 25% for SNS (Ibid, 108). With this being known, it puts into question the information displayed in Figure 5. Although more single individuals are moving to the South, the amount of family units moving with children are not declining as one would expect.
There are multiple reasons for this. Once again, the War on Drugs could be contributing to this decline. Additionally, there has been a shift in societal norms towards marriage with fewer people getting married. Specifically for African-American individuals living in a household, the rate of marriage dropped from 49.4% in 1940 to 35.9% in 1965 (Ruggles 1994, 138). Additionally, society has started a new trend where women have children later in their lives, which has resulted in more family units between couples to not include a child. It is also important to point that African-American families have a differing family structure than their white counterparts. African-Americans households have higher rates of single parents and are more likely to be composed of extended family than white households (Ruggles 1994, 136).

Figure 6. Educational Attainment of African-Americans Moving to the South, 1940, 1960-2000.
The educational attainment of African-Americans migrating to the South has steadily increased as the economic opportunities for individuals with post-secondary education have grown exponentially. As previously mentioned, manufacturing and service jobs were becoming more technical and required prospective employees have a post-secondary educational degree. Figure 6 shows that from 1940 to 1970, the educational attainment for people migrating to the South was low as the majority of migrants only had less than a high school degree. Education improved during the 1980s as more individuals were entering into a more integrated college system as predominantly white institutions (PWIs) were admitting minority students. In 1990, the landscaped changed as college campuses for PWIs had social environments that were permissible enough for African-Americans to attend. This led to a substantial amount of individuals to have the ability to acquire some college. Education. More importantly people with bachelors degree and more advanced degrees appeared in the South. As more investment was put into education and programs were developed for African-American students, high school and GED attainment became a norm for migrant African-Americans. This higher quality of education continues to attract more African-Americans with high school/diplomas GED, bachelor’s degrees, and advanced degrees.
Conclusion
Ultimately, The New Great Migration marks the unprecedented return for African-Americans to the South. With various economic opportunities that were not present before and a desire to be connected to family, African-Americans saw this as a chance to recapture the South and make it their own. African-Americans migrating to the South were younger, less educated, and male in 1960, however in 2000, migrants tended to be older, more educated, and more likely to be female. These factors have helped revitalized the South and to create a community for African-Americans to connect. With their immigration, African-Americans have helped turn the South from the Cotton Belt to the Black Belt. A suppressive area of the nation that once regulated African-Americans to slavery is now called their home as free, prospering individuals.
Work Cited
Allen, Walter. “The Shifting Social and Economic Tides of Black America, 1950-1980.” Annual Review of Sociology 12.1 (1986): 277-306. Annual Review of Sociology. Web. 10 Oct. 2016.
Curtis, Katherine J. “U.S. Return Migration and the Decline in Southern Black Disadvantage, 1970-2000.” Social Science Computing Cooperative. Working paper no. No. 2011-02. Center for Demography and Ecology, University of Wisconsin-Madison. UW Board of Regents, University of Wisconsin – Madison, 2011. Web. 26 Sept. 2016.
DeWaard, Jack, Katherine J. Curtis, and Glenn V. Fuguitt. “The ‘New Great Migration’ of Blacks to the U.S. South” Demographic Research DemRes 34 (2016): 885-98. Web. 26 Sept. 2016.
“Executive Order 8802 – Prohibition of Discrimination in the Defense Industry.” Franklin D. Roosevelt Presidential Library and Museum – Our Documents. Web. 10 Oct. 2016.
Frey, William H. “The New Great Migration: Black Americans’ Return to the South, 1965-2000.” Brookings. The Brookings Institution, 1 May 2004. Web. 25 Sept. 2016.
Gregory, James N. The Southern Diaspora: How the Great Migrations of Black and White Southerners Transformed America. Chapel Hill: U of North Carolina, 2005. Print.
Grossman, James R. Land of Hope: Chicago, Black Southerners, and the Great Migration. Chicago: U of Chicago, 1989. ACLS Humanities E-Book. 22 Dec. 2014. Web. 30 Oct. 2016.
Hunt, Matthew O., Larry L. Hunt, and William W. Falk. “Twenty-First-Century Trends in Black Migration to the U.S. South: Demographic and Subjective Predictors.” Social Science Quarterly 94.5 (2013): 1398-1413. Wiley Online Library. Web. 26 Sept. 2016.
Hunt, Larry L., Matthew O. Hunt, and William W. Falk. “Who Is Headed South? U.S. Migration Trends in Black and White, 1970-2000.” Social Forces 87.1 (2008): 95-119. Jstor. Web. 10 Oct. 2016.
Hyde, Charles K. Arsenal of Democracy: The American Automobile Industry in World War II. Detroit: Wayne State UP, 2013. Project Muse. 2013. Web. 30 Oct. 2016.
Kalafsky, Ronald. “The Manufacturing Sector in the South: Status and Recent Trends.” Southeastern Geographer 46.2 (2006): 259-77. ProQuest Central. Web. 30 Oct. 2016.
Nelson, Jack. “South’s Job Growth Outstrips U.S.” Los Angeles Times 2 Jan. 1968: D8. ProQuest. Web. 10 Oct. 2016.
Price-Spratlen, Townsand. “Urban Destination Selection among African Americans during the 1950s Great Migration.” Social Science History Soc. Sci. Hist. 32.03 (2008): 437-69. Project Muse. Web. 31 Oct. 2016.
Schulman, Bruce J. From Cotton Belt to Sunbelt: Federal Policy, Economic Development, and the Transformation of the South, 1938-1980. New York: Oxford UP, 1991. Print.
Richardson, Derrick L. Availability of Large, Cheap Housing May Have Driven the Great Migration of African Americans to the South from 1990 to 2000. Diss. Long Island U – Brooklyn, 2011. ProQuest. Web. 3 Oct. 2016.
Ruggles, Steve. “The Origins of African-American Family Structure.” American Sociological Review 59.1 (1994): 136-51. JSTOR. Web. 12 Nov. 2016.