

by Liam Fortin
Introduction and Review of Existing Literature
The goal of this post is to examine the industries occupied by first generation immigrants in the United States during the latter half of the Industrial Revolution, as well as the differences in first generation immigrants’ industries with consideration to both region and sex. To understand such trends is crucial for a few reasons. By the end of the Second Industrial Revolution, on the eve of World War I, first generation immigrants and their children comprised 38.4 percent of the United States Population. (Jaher 1968, 81) In many of the larger cities alone, such as New York, Chicago, and Detroit, three-quarters of the population was composed of immigrants and their children. (Hirschmann 2009) The impetus for this post lies with the decided impact of first generation immigrants on the makeup of America and its workforce.
To understand first generation immigrants’ industry is to better understand their economic position in the nation at the time, which can be crucial to understanding the opportunity for upward mobility in society as well as the opportunity that they might have afforded the next generation. By examining the industries that employed first generation immigrants across distinct regions of the United States as well as to examine the discrepancies in the opportunities available to first generation women, this post seeks to paint a clearer picture of the first generation immigrant’s life in the United States during the late nineteenth and early twentieth centuries. As the era of this post, the Second Industrial Revolution expanded beyond the coal, iron, railroads, and textiles that defined the First Industrial Revolution to include electricity, petroleum, and steel which prompted substantial growth in the United States economy. (Engelman) Although sometimes cited as beginning in force in 1870, the Second Industrial Revolution is usually described as the seventy year period from the 1850s to the late 1910s, ending with America’s entrance into the First World War. The data capture for this project will therefore begin in 1850 and end with 1920, encapsulating the entirety of the Second Industrial Revolution.
The four dimensions of analysis that will structure this project are birthplace, industry, region, and sex. The first of these considerations, birthplace, is crucial as a starting point to this project, as the data show when a person’s birthplace differed from the United States. Birthplace can be used to create a distinct category for the primary group of this post’s focus: first generation immigrants. Next, and perhaps most crucially, industry will be considered. To separate by industry provides data on how many first generation immigrants were employed in each of the seven broad categories of industry (to be defined in detail in the methods section). Finally, sex and region should be considered. These factors will each be important as they allow a greater insight into the discrepancies across a given industry. Sex is a crucial consideration as it is key to understanding the differences and or similarities between the immigrant men and women seeking work in America during the Second Industrial Revolution. Region, too, is key to describing where immigrants were employed, and from an analytical standpoint, is crucial in identifying what regions employed the most first generation immigrants over time in a given industry.
Oft written upon, the topic of immigration during the Second Industrial Revolution is of particular interest for several reasons. For one, it is at this point that the stream of new immigrants changed. Before the Civil War, British, German and Irish immigrants predominated, but after the Civil War, far larger and more diverse groups from nationalities that spanned the globe began to settle across the United States. (Del Mar 2011, 40) It is during this period of transition to the Second Industrial Revolution that a great deal of scholarship intervenes, establishing the role of the immigrant in the world of growing American labor and industry. By providing critical background information, previous scholarship establishes a solid foundation upon which central themes to this post can be elaborated upon and explored in a meaningful way.
Among the central themes to consider will be geography. This is a point where this post will seek to deepen the trends discussed in existing scholarship. For example, according to Del Mar (2011, 70) most Chinese and Japanese immigrants who arrived in the US from the 1850s onwards settled in California and other Western states. To understand why this was, I defer to Del Mar’s (2011, 71) point that the predominantly male, Asian immigrant population in this era came to America with the intention of working on the West Coast for only a few years, often with the goal to return home to their families after accumulating enough wealth to lift their families from poverty. Additionally, according to Jacobson (67), labor agents in Asia pointed Chinese and Japanese laborers specifically toward the West coast, just as Hungarian labor agents steered their countrymen toward Pennsylvania mines, while Mexican labor agents pointed their compatriots toward Texas smelter houses. Hence, previous literature affords me valuable background information when it comes to the geography of immigration, allowing me to investigate deeper within specific regions.
I also want to explore how the apparent growth, or lack of growth, in a given industry affected immigrants’ occupations. For instance, according to Hirschmann (2009) the figure that should show the greatest growth over this period is manufacturing. This industry grew twice as fast as the American workforce during the course of the Second Industrial Revolution, and added the greatest share of workers. (Hirschmann 2009) With this in mind, I want to examine if this trend is visible in the data, and if it is, question further. For example, how did the growth of manufacturing manifest itself in the employment of women versus men?
My project seeks to build off of the trends and themes elucidated in the existing scholarship. By more carefully examining occupation and sex across regions for immigrants during the Second Industrial Revolution, I seek to gain a greater precision for the trends discussed in previous scholarship. For one, armed with the IPUMS data, the geography of immigration stands out as something I hope to describe in greater detail. Do the trends in the data confirm the more qualitative assessments of why immigrants migrated to a certain region? Second, now that I have a better understanding of the landscape and growth of American industry from 1860 onwards, I want to situate my variables of occupation and sex into the larger, macroeconomic trends that affected American industry beginning with 1860. Third, as a catch-all category that relates the first two questions to deeper themes of sexism, I want to ask what industries immigrants of both sexes occupied across the regions of the United States. In which regions did immigrant women enjoy higher employment? In what regions were there greater disparities between the sexes for occupation? In which were they more similar? In the end, my hope is that my project can come to answer these questions so that I can situate my findings back into the larger context and conversation occupied by the existing scholarship.
Data/Figures
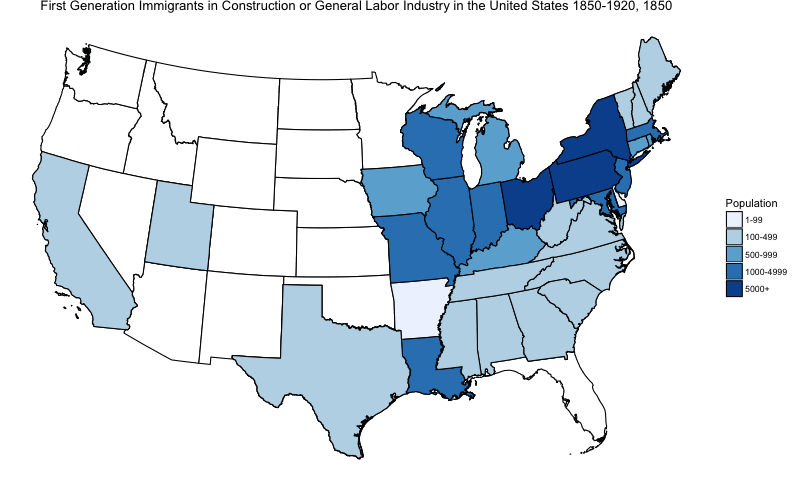
Figure 1: Density map of first generation immigrants employed in construction/general labor state by state from 1850 to 1920.
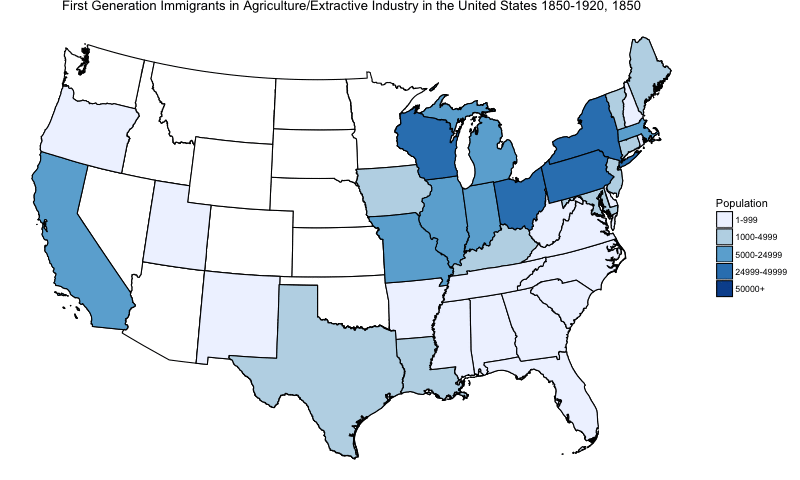
Figure 2: Density map of first generation immigrants employed in agriculture/extractive industry state by state from 1850 to 1920.

Figure 3: Density map of first generation immigrants employed in manufacturing industry state by state from 1850 to 1920.
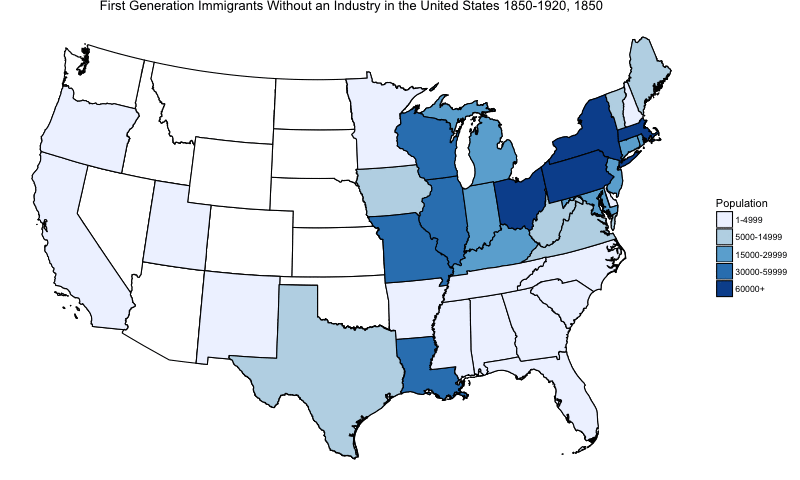
Figure 4: Density map of first generation immigrants without an industry state by state from 1850 to 1920.

Figure 5: Density map of first generation immigrants employed in the service industry state by state from 1850 to 1920.
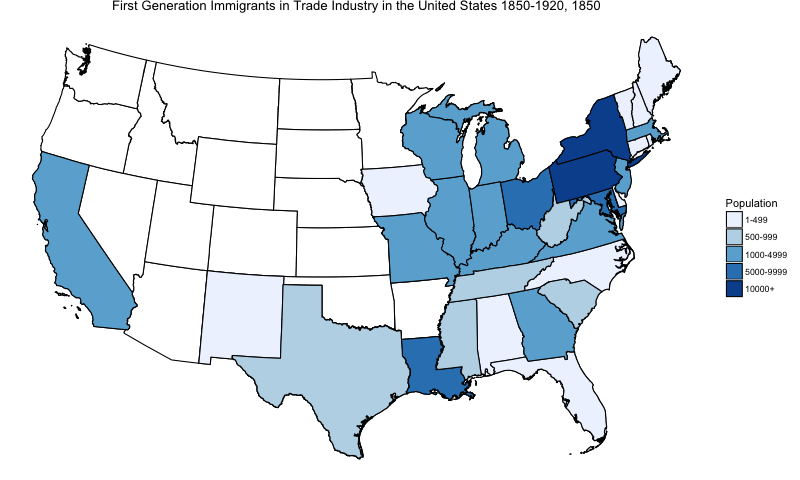
Figure 6: Density map of first generation immigrants employed in the trade industry state by state from 1850 to 1920.
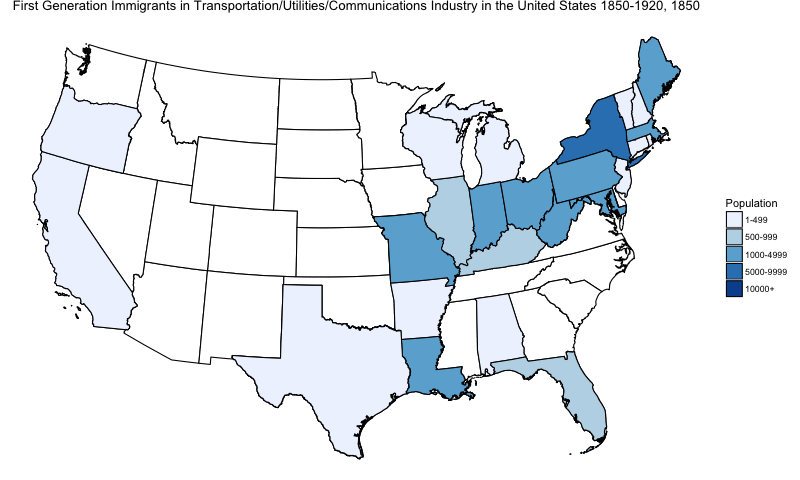
Figure 7: Density map of first generation immigrants employed in the transportation/utilities/communications industry state by state from 1850 to 1920.
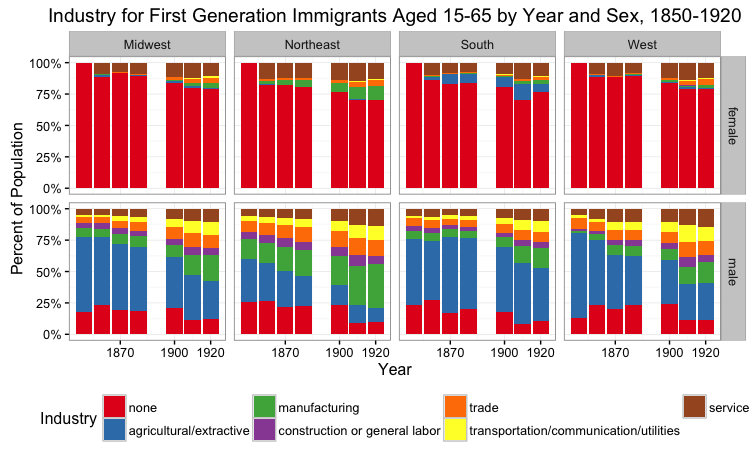
Figure 8: Column graph showing the percentage of male and female population of immigrants employed in each of the seven industries by region.
Methods
Figures 1 through 7 above show animated gif maps for the population of first generation immigrants to the U.S. by state from the year 1850 to 1920. The data were drawn from IPUMS 1% samples for each of these census years. Entries indicating a birthplace outside of the United States and its territories were included in the segment of the American population mapped in these figures. First generation immigrants were included in these figures only if they fell within typical working age, defined here as 15 years of age to 65 years of age. Data for Alaska and Hawaii are not included in these figures. I have allocated the IPUMS codes for IND1950 into seven broad industrial groupings. The agricultural/extractive industry includes all entries under the heading of “Agriculture, Forestry, and Fishing” as well as “Mining.” Construction and general labor was defined as all entries under “Construction” and “Common or General Labor.” Manufacturing was defined as all entries under “Manufacturing” including both “Durable Goods” and “Nondurable Goods.” Service included all entries under the heading of “Finance, Insurance, and Real Estate,” “Business and Repair Services,” “Personal Services,” “Entertainment and Recreation Services,” “Professional and Related Services,” and “Public Administration.” Trade was defined as all entries under “Wholesale and Retail Trade.” The industry of Transportation, Utilities, and Communications was defined as all entries under the heading of “Transportation,” “Telecommunications,” and “Utilities and Sanitary Services.” Immigrants without an industry consisted of all entries that were not under any of the aforementioned headings, which included no response or non-occupational responses. As shown on the scale, darker shades of blue indicate a higher numbers of first generation immigrants in the given industry a given state. Note that the scales are not standard and vary from figure to figure.
Figure 8 shows a column graph, which graphs the percentage of all working age, first generation immigrants in each of the seven industrial categories outlined above by both sex and region. The data were drawn from IPUMS 1% samples for each of these census years. Entries indicating a birthplace outside of the United States and its territories were included in the segment of the American population mapped in these figures. Working age is again defined as 15 years of age to 65 years of age. The four regions are defined as the Midwest (Illinois, Indiana, Iowa, Kansas, Michigan, Minnesota, Missouri, Nebraska, North Dakota, Ohio, South Dakota, Wisconsin), the Northeast (Connecticut, Maine, Massachusetts, New Hampshire, New Jersey, New York, Pennsylvania, Rhode Island, Vermont), the South (Alabama, Arkansas, Delaware, District of Columbia, Florida, Georgia, Kentucky, Louisiana, Maryland, Mississippi, North Carolina, Oklahoma, South Carolina, Tennessee, Texas, Virginia, West Virginia), and the West (Arizona, California, Colorado, Idaho, Montana, Nevada, New Mexico, Oregon, Utah, Washington, Wyoming). Data for Alaska and Hawaii are not included in these figures. Link to generate code for the animated gif maps as well as the column graph can be found here.
Results Section
General Trend
There is a strong general trend across Figures 1 through 7. What stands out immediately is the fact that the greatest number of first generation immigrants settled in the Northeast and the Midwest. Although the West and South certainly came out strong for a few industries and a few states in particular (California for the West and Texas for the South), it is important to realize that many of the first generation immigrants appear to have entered in the Northeastern seaboard states and moved Westward, remaining in the northern half of the country. This overarching trend confirms what is discussed in the literature, which states that of the 25 million immigrants who settled in the United States after the Civil War and before World War I, most landed in the cities and towns of the Northeast and northern Midwest United States. (Olsen 2002, 137)
Manufacturing Boom
Figure 3: Density map of first generation immigrants employed in manufacturing industry state by state from 1850 to 1920.
Perhaps best exemplifying this trend is the manufacturing industry. This is the industry most commonly associated with the Second Industrial Revolution, and judging by these figures, perhaps for good reason. Figure 3 indicates that the majority of immigrants who were employed in the manufacturing industry lived in the Northeast and the Midwest. The South and the West, with the exception of California, had fewer immigrants employed in this industry. This supports the existing scholarship, which contends that immigrants were initially drawn by the prospect of land for agricultural pursuits but arrived to find that unless they travelled far to the West, there was very little available land for farming. (Olsen 2002, 137) As a result, immigrants flocked to industrial urban centers of the United States for employment where they met the demand for a growing labor supply during the decades of titanic industrial growth. (Jaher, 82-85) The manufacturing industry exploded from employing 14% of the American labor force in 1880 to over 25% of the American labor force in 1920, pulling millions more workers into the grist and poor working conditions with each passing decade. (Hirschmann 2009) By the eve of World War I, first generation immigrants made up almost 60 percent of the manufacturing industry. (Brody 1993, 15)
Figure 8: Column graph showing the percentage of male and female population of immigrants employed in each of the seven industries by region.
Figure 8 better qualifies this trend. From 1850 to 1920, the figure indicates a marked increase in the number of first generation immigrants employed in the manufacturing industry. Manufacturing grows across every region of the country, but, as expected, it grows the most in the Midwest and the Northeast.
Yet, Figure 8 clearly shows that those who enjoyed this growth in manufacturing employment were primarily first generation men. Hirschmann (2009) contends that young immigrant men were more willing to accept lower wages and inferior working conditions to native-born men, and were often the first to be recruited to unskilled labor positions in factories. We see very little growth, on the other hand, in the percentage of women employed in the manufacturing industry across the entirety of the Second Industrial Revolution. The only region that employed a significant fraction of female workers in manufacturing was the Northeast, which confirms the assessment of scholars that women in this region were uniquely positioned to feed into the lowest-wage earning positions in the manufacturing industry. (Hirschmann 2009) By accepting a fraction of what their male counterparts were earning, women of the Northeast filled in the lowest ranks of what was the mainstay of the region’s economy. (Hirschmann 2009) Yet this fraction was but a small minority when compared to male first generation immigrants, who were enjoying increased employment in manufacturing across the country.
In a geographic sense, both Figure 3 and Figure 8 indicate a clear trend. First generation immigrants fed into this industry in large numbers in the Northeast and the Midwest, with the number of women in the Northeast entering manufacturing nearly quadrupling over this seventy-year time span. According to Cobb (1984, 34), this disproportionality of industrial expansion created an insatiable demand for new labor that fed on itself, resulting in fewer first generation immigrants to other regions of the country, such as the South. Dominated by a declining agriculture industry, the South also sought industrialization as a respite from its widespread, crippling poverty. (Cobb 1984, 7) Although, much of the industrialization during the 1880s and 1890s in the South was limited in scope, and often drew on native southerners or blacks who had little hope of scraping by with agriculture to fill the ranks of the textile mills or lumber operations. (Cobb 1984, 68) As the South had a readily available supply of low wage labor for its fields and its factories, it did not draw a large number of first generation immigrants.
Agricultural and Extractive Trends
So although it is apparent from Figure 8 that the overwhelming majority of male immigrants in the South during the Second Industrial Revolution were employed in agriculture, it is important to note that there were very few immigrants going to the South in the first place. Although by 1880 about two thirds of the immigrant population to the American South was employed in the agriculture industry, we see from Figure 2 that many of the key agricultural states in the South such as Alabama, Georgia, and South Carolina employed less than 5,000 first generation immigrants in agriculture during this seventy-year period. So while states like Texas and Florida gained a more comparable number of first generation immigrants in agriculture when compared to the rest of the country, much of the South remained relatively sparse with regard to immigrant activity. Yet, it is interesting to note that despite the fact that the Southern agricultural industry was declining, it still managed to claim the largest share of immigrants who settled in the South.
Figure 2: Density map of first generation immigrants employed in agriculture/extractive industry state by state from 1850 to 1920.
Apart from the South, the Northeast and the Midwest gained a large number of first generation immigrants in the agricultural and extractive industry. But perhaps most interestingly, Figure 2 also indicates a marked increase in the number of immigrants employed in the agriculture and extractive industry in California from 1850 to 1870. This reaffirms in a more precise sense one of the assessments made by Rees (2013, 35) who asserted that starting in 1849, the California Gold Rush drew a large number of immigrants to the West Coast. In particular, Rees (2013, 35) asserts that a great number of these immigrants were Chinese, who for several years mined for gold, but eventually turned from the extractive to the agricultural. Rees (2013, 36) contends that Chinese immigrants built the irrigation canals, cleared the brush, and picked the fruit that helped to establish agriculture as California’s largest and most enduring industry. Accordingly, Figure 8 indicates that for the entirety of the Second Industrial Revolution, agriculture and extraction remained the West’s most dominant industry.
Transportation and Communications on the west coast
Figure 7: Density map of first generation immigrants employed in the transportation/utilities/communications industry state by state from 1850 to 1920.
The number of first generation immigrants employed in California in the transportation, utilities, and communications industry also jumped dramatically during the same time span. This was likely in part due to the construction of the Transcontinental Railroad, as this massive project had just been finished in 1869 and there were a large number of jobs available on the West Coast with the Central Pacific Railway. (Rees 2013, 35) In addition to over-land transportation though, the prospect of water transportation also became increasingly necessary in California during this period with a growing number of ships, especially whaling vessels, restocking and refueling in Californian ports. (Philbrick 2000, 45) Interestingly though, much like the agricultural and extractive industry, Figure 8 also indicates that those employed in transportation, utilities, and communication during this period (1850-1870) in the West were almost exclusively male. This likely has to do with the fact that a large number of first generation immigrants to the West, whether they came for to build a railroad, farm, or mine, were young East Asian men, who were drawn to this region by recruiters as well as decent earning opportunities that could help improve their lot upon returning to China, Korea, or Japan. (Del Mar 2011, 71 ; Jacobson, 67)
Yet, in the West the proportion of people employed in the transportation, utilities, and communications industry was not nearly as high as agriculture or manufacturing. Hirschmann (2009) contends that while immigrants were important to the transportation and communications sectors, they were held secondary to native-born and 3rd generation Americans. The data supports his claim that nearly two thirds of the new workers to the railroads were in fact other groups and not first generation immigrants. (Hirschmann 2009)
Absence of Women in Construction and Trade
Figure 6: Density map of first generation immigrants employed in the trade industry state by state from 1850 to 1920.
Both the industries of construction and trade grew during the Second Industrial Revolution, but, much like manufacturing and agriculture or transportation, utilities, and communication, neither of these industries employed a great deal of women. The construction and general labor industry, in fact, does not even appear on Figure 8 for women of any region. As an industry today that remains very much male-dominated, it is little surprise that the growth of this industry among first generation immigrants was exclusively among men. Trade was a bit better, providing room for more women to enter as the American manufacturing economy grew to such a level that the distribution and selling of good became of paramount importance. (Hirschmann 2009) But still, the number of women employed in trade remained relatively low.
Lack of Female Employment in all but Service
There were only two industries where the percentage of first generation immigrant women employed was higher than men. First, for those first generation immigrants without work, designated as not working or working in a non-occupational capacity, women were far and away the leaders.
Figure 8: Column graph showing the percentage of male and female population of immigrants employed in each of the seven industries by region.
Figure 4: Density map of first generation immigrants without an industry state by state from 1850 to 1920.
Figure 8 and Figure 4 tell a story that I have seen in virtually no other source. While the number of first generation men without an industry hovers at around 15 to 20 percent, for each of the four regions of the United States the proportion of women without an industry rarely ever dips below 75 percent. The macroeconomic trends in employment that mark the growth of manufacturing and the decline of agriculture in the United States are not nearly as clear or as telling in the first generation women’s data. The contrast between men and women is stark, and indicates that despite the fact that many of these migrants were very poor, the traditional norms where the man brings home the earnings and the woman kept the home were very much in force. According to the data, the overwhelming majority of first generation women were observers to the immense growth in employment and industrial transformation during this period.
Figure 5: Density map of first generation immigrants employed in the service industry state by state from 1850 to 1920.
The only occupational industry where women consistently had higher levels of employment than men was in services. Hirschmann (2009) contends that concurrent with the creation of an industrial society from 1880 to 1920 was the expansion of business and the beginnings of public provision of education, health care, and welfare, each of which are evident in the increases of workers in producer services and social services. Although, he also notes that many of the best paying service jobs, such as banking, business management, education, and government were filled by 3rd and higher generation Americans. (Hirschmann 2009) This left first generation immigrants in a unique position where instead of displacing native-born Americans as they had in many other low paying industries, they made room for expansion and development that was likely to push a native born American up while they remained in jobs with lower pay and lower status.
Conclusion:
I would like to relate my analysis back to my original questions. Chiefly, I sought to understand with a greater precision some of the key trends in the employment of first generation immigrants and the nature of their work in the United States. I focused specifically on the geographical component of this inquiry, and with my figures attempted to describe where immigrants were employed and in what industry. In my analysis, I sought to delve a deeper into some of the standout trends illuminated by these figures. In doing this, I sought to qualify the visible trends with the aid of existing scholarship.
I found that on the whole the growth of a given industry appeared to have a positive relationship with the number of first generation immigrants employed in a given industry. In manufacturing, for instance, we saw that there was a large increase in the number of first generation immigrants employed in this fast growing industry over this seventy-year period.
But one should be careful not to assume that the growth of a given industry necessarily meant that a large number of first generation immigrants would be employed by a given industry. For example, despite the fact that the transportation, utilities, and communications industry enjoyed explosive growth from 1850 to 1920, the percent of immigrants who were employed by this industry paled in comparison to agriculture or manufacturing. This was for two reasons. One, the total number of jobs available in the transportation, utilities, and communications industry was less than in manufacturing and agriculture. (Hirschmann 2009) Second, there was an inherent bias in this industry against first generation immigrants in favor of 3rd and higher generation Americans. (Brody 1993) Hence, this post not only demonstrates the geographic component of employment for first generation immigrants, but also what growing industries were actually open to and recruiting from populations of first generation immigrants.
Finally, what I believe to be the most striking aspect of this post is the incredibly high number of first generation women who remained unemployed during the entirety of the Second Industrial Revolution. With the exception of a steady ten percent or so to service and the occasional five to ten percent in manufacturing or agriculture, the majority of first generation women remained spectators to the incredible growth in employment in the American economy that occurred in this era. At the beginning of this project I posed a question: in which regions do we see the greatest disparity in the number of women versus men employed in a given industry? Looking at Figure 8, it is hard to say that any of the four regions of the United States are even close to being remotely equitable with respect to the number of women versus men employed in an industry besides service. At the close of the Second Industrial Revolution, the number of women employed outside of the service industry had grown from seventy years prior. But unlike for men, this growth was incremental, and lagged behind the breakneck pace of expansion achieved during this unique era in American history.
Works Cited:
Brody, David. Workers in Industrial America: Essays on the 20th Century Struggle. New York: Oxford Press, 1993.
Cobb, James. Industrialization and Southern Society 1877-1984, Kentucky: University Press of Kentucky, 1984.
Del Mar, David. The American Family: From Obligation to Freedom. New York: Palgrave Macmillan, 2011.
Engelman, Ryan. “The Second Industrial Revolution,” US History Scene, 2016, accessed November 12, 2016.
Hirschmann, Charles. “Immigration and the American Industrial Revolution from 1880-1920,” Social Science Research 38 (2009), accessed September 24th, 2016.
Jacobson, Matthew. Barbarian Virtues. New York: Hill and Wang.
Jaher, Frederic. The Age of Industrialism in America; Essays in Social Structure and Cultural Values. New York: Free Press, 1968.
Olsen, James. Encyclopedia of the Industrial Revolution in America. Westport: Greenwood Press, 2002.
Philbrick, Nathaniel. In the Heart of the Sea: The Tragedy of the Whaleship Essex. New York: Viking Press, 2000.
Rees, Jonathan. Industrialization and the Transformation of American Life. New York: M.E. Sharp, 2013.