

Introduction
Discrimination has long been a part of the United States’ culture, a stain-like reminder of our nation’s past. From 1940-1990 government policy, location, and time period have all played major roles in both inciting and restraining the ongoing racist culture that has affected the lives of so many Americans. When President Franklin Roosevelt signed the Servicemen’s Readjustment Act in 1944, he passed the first “race-neutral” piece of legislation for veterans in the United States (Turner and Bound 2002, 5). This bill was passed with the goal of easing the transition for veterans returning home from the Second World War in Europe. This legislation made it possible for tens of thousands of veterans to obtain undergraduate degrees by funding their college educations (Altschuler and Blumin 2009, 6). The government then extended this bill to Korean War veterans in 1952 and Vietnam veterans in 1966 and continued to provide the same aid for the various returning servicemen through this time period (Dortch 2016, 7).
While most Americans regard the GI Bill as an unqualified success, one question that arises about its triumph is whether veterans of all races experienced the positive impacts of the bill equally. Many Americans, including former President Bill Clinton, praise the Servicemen Readjustment Act for its long-lasting effects and its ability to not only help build better lives for veterans, but to also fuel the impressive economic growth of the second half of the 20th century (Altschuler and Blumin 2009).
“Passed in an era of entrenched racial prejudice,” this bill included nothing that would distinguish the race of the veterans it aided (Altschuler and Blumin 2009, 129). However, many historians have discovered that the vast majority of the Bill’s beneficiaries were white. This poses the query: was the so highly regarded GI Bill a discriminatory piece of legislation? If so, why, and once extended, did the bill continue to favor white veterans even after the civil rights movement? The purpose of this study is to discover the connection between race, location and the ability of the veterans to attain higher education through the aid provided by the GI Bill.
Sarah Turner and John Bound’s in depth analysis found the effects of the GI Bill to be racially unequal following World War II. The educational level completed by the veterans differed for black and white veterans, even though the bill technically provided the exact same aid to both races (Turner and Bound 2002). Turner and Bound argue that this disparity was completely based upon the location in which the veterans resided. In Turner and Bound’s research, they discovered that the accessibility of upper level education was much more constricted in the South than in the North. The colleges for black people were much less numerous than those for whites and the enrollment sizes were smaller in the South than in the North (Turner and Bound 2002, 7). Furthermore, admissions officers were much more likely to allow a black person into a traditionally white college in the Northern states than anywhere else. Harley L. Browning, Sally C. Lopreato, and Dudley L. Poston add to this argument and claim that, immediately after World War II, this inequality was also a result of different sets of societal norms in the different places where the veterans lived. They argue that when black veterans returned home, they were much less likely to try to leave the familiar socioeconomic class they had belonged to before the war. This was a lower class than most whites had been in pre-war. However, all of these historians only analyze the effects of the GI Bill immediately after World War II and fail to include evaluation of the time when Jim Crow did not play a major role in the South. In and of itself, the Bill was “race-neutral”; however, multiple external factors help explain why the benefits of the Bill were distributed unevenly among the races.
In addition to looking at the correlation between race, location, and levels of education of the veterans following World War II, I also analyze these trends in the time period following the Korean Conflict GI Bill in 1952 and the Post-Korean Conflict and Vietnam Era GI Bill in 1966. These two extensions provided similar benefits to the veterans of each respective war (Dortch 2016, 7). These later extensions occurred during the Cold War era, a tumultuous time period in American history with an extreme effect on the society and education system. During this time the government allocated funds to enhance both public and private educational opportunities, especially in science and math (Thelin, Edwards, and Moyen 2016). In addition, the Civil Rights movement in the 1960s broke down barriers for black people in higher education all across the country and most notably, in the South. However, there is very little literature discussing the distribution of the GI Bill during this time frame, so all analysis I have done is based upon the consideration of the census data and the information available about the effects of the Civil Rights movement and Cold War policies, rather than on historians’ studies of the bills.
Methods
I have used census data to analyze the educational attainment of black and white veterans from 1940 to 1990. I have created three different types of data visualizations to show my findings. This time period includes the veterans from World War II, the veterans from the Korea Conflict, and the veterans from the Vietnam War. The data for all the visualizations are drawn from IPUMS (Integrated Public Use Microdata Series) 1% samples for 1940, 1950, 1960 and 1990. For 1970, the data are from 1% state fm2 and for 1980 the data are from 1% metro. Each year’s data were weighted by PERWT. Only white and black male veterans are included in this analysis. I made the decision to control external factors and only consider black and white males in order to avoid skewing the data with females and other minority races who would have had different experiences in their military and post-military careers. Until 1960, data for Alaska and Hawaii are not included in the IPUMS database and the data for the two states were dealt with differently for each type of visualization.
The four sets of United States maps show either the total population of black or white veterans, or the educated population of veterans of each race. Figures one and two show the total populations of white male veterans and black male veterans in each state, respectively. Figures three and four show only the population of the “educated” veterans sorted by race. For these sets of data visualizations, the term “educated” refers to the veterans with education levels higher than a twelfth grade level, because this is what the GI Bill supported. Data for Alaska and Hawaii have been included in all years, but because no data exist for the two states in the 1940 and 1950 censuses, the information seen in this visualization cannot be analyzed until 1960 for either Alaska or Hawaii.
The bar graph shows the population of black and white veterans sorted into three levels of education. Data for Alaska and Hawaii are included for all years in this visualization. The three divisions of education for this set of graphs are as follows: education less than a twelfth grade level, a completed high school degree (education through the twelfth grade level), and any amount of education above a twelfth grade level.
The spine graph shows the percentages of the black and white veterans based upon their education. The education levels are broken into the same three categories as the bar graph and the data is then sorted by region. The four regions are the Northeast (Connecticut, Maine, Massachusetts, New Hampshire, New Jersey, New York, Pennsylvania, Rhode Island, Vermont), the Midwest (Illinois, Indiana, Iowa, Kansas, Michigan, Minnesota, Missouri, Nebraska, North Dakota, Ohio, South Dakota, Wisconsin), the South (Alabama, Arkansas, Delaware, District of Columbia, Florida, Georgia, Kentucky, Louisiana, Maryland, Mississippi, North Carolina, Oklahoma, South Carolina, Tennessee, Texas, Virginia, West Virginia), and the West (Arizona, California, Colorado, Idaho, Montana, Nevada, New Mexico, Oregon, Utah, Washington, Wyoming, Alaska, Hawaii). The width of each bar represents the population of veterans in that region, but it is important to note that the widths of each spine graph do not correlate to each other. There are far fewer black veterans than white veterans even if their bar widths are the same.
Code for these visualizations can be found here.
Results

Figure 1 – White Veteran Population by State

Figure 2 – Black Veteran Population by State
As shown in Figures 1 and 2, the population of veterans between 1940 and 1990 was primarily white. This has to do with the fact that there were so many more white people in the military and in the overall population of the United States. Leading up to 1940, the military was primarily made up of white men. There were only six black units in the military before World War II, accounting for fewer than 5,000 servicemen. Even during the Second World War black males were much more likely to be deferred from service due to failing the literacy test and being labeled “mentally deficient,” a practice that had been used to exclude blacks from many areas of society for a long time (Turner and Bound 2002, 4). These two maps also show where the majority of the populations of black and white veterans lived. Most black veterans lived in the Northeast, eastern Midwest, and the southern states. California and Texas also have relatively high populations of black veterans during this time period. White veterans are somewhat more equally spread among the states but also reside more heavily in the same areas that the black veterans do. As time goes on, there is an increase in the number of veterans, as seen in the maps. The populations of both races become more dispersed, but continue to remain the most concentrated in the Northeast, South, and parts of the Midwest.
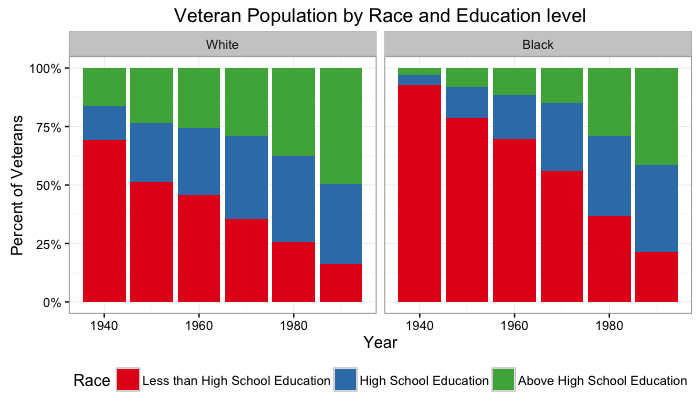
Figure 3 – Veteran Population by Educational Attainment (Percent)
Figure 3 displays the mass trends across the United States throughout the time period. There is an increase in the number of veterans educated above a high school level for both white and black veterans between 1940 and 1950, when the GI Bill is enacted. This is to be expected and shows that the aid the GI Bill provided for all veterans to enroll in higher education was successful (Altschuler and Blumin 2009). Over the 60 years of this study, the increase of both black and white servicemen with higher levels of education is relatively steady. According to Altushuler and Blumin, this fact of longevity proves the success of the GI Bill and is the reason it is so highly regarded.
Another trend in Figure 3 however, shows that the effects of the GI Bill were not “race-neutral”. Throughout the whole time period I analyze, white veterans constantly have a higher percentage of population with the highest level of education. Browning, Lopreato, and Poston argue that this is a result of the pre-existing societal norms that put pressure on black veterans to re-engage in their society in the same socioeconomic class as they had left it in, even if the GI Bill gave them the opportunity to elevate that status through free education. However, the researchers also acknowledge that the veterans’ location and the racism present in that location have the largest effects on their ability to use the GI Bill. Because the article by Browning, Lopreato, and Poston was published in 1974, I contend that their argument might be slightly out of date and somewhat biased. However, it does align with the trends immediately after 1940 so it is an important claim to consider. The argument based upon location is discussed more in relationship to Figures 6 and 7 and the article written by Turner and Bound. Even though white veterans have a higher percentage of people educated further than a high school degree, towards the very end of the time period analyzed, the percent of black veterans with higher level education increases to about 40%, only 10 percentage points less than the white veterans, who had about 50% of their population with above a high school education. As discussed earlier, literature on the extensions of the GI Bill is scarce. Yet, one can deduct from knowledge about the time period that this rise in higher education for black veterans was aided by the effects of the Civil Rights movement and Cold War time period. Some results from that era, like affirmative action, pressure for institutions to become more racially inclusive and diverse, the normalization of college degrees for people in all socioeconomic classes, and the federal funding of state colleges, might all have effects that would lead to the increase in the percent of black veterans with some sort of higher education.
The most remarkable trend from Figure 3, however, is the overall data change from 1940 to 1990 for the black veterans. The percentage of black veterans with a higher than high school education goes from less than five percent to about forty percent, compared to the white veterans who go from about twenty percent to fifty percent. This shows that, overall, the average education level for black veterans has changed drastically. According to Bound and Turner, this might have more to do with Civil Rights movements than the GI Bill, but like stated above there is no definite research done that would prove this.
A final trend that can be gathered from Figure 3 is the stagnation of the percent of veterans, both black and white, that only earned high school degrees after 1960 coupled with a decrease in the number of veterans with less than a high school degree. About 40% of black and white veterans are educated to a twelfth grade level from 1970 to 1990. I speculate that this is because of the normalization of college degrees and the accessibility of increasingly large number of colleges and universities nationwide allowing those who would generally have just a high school degree a chance to have college education on top of their high school diploma (Thelin, Edwards and Moyen 2016). Because so many more people ended up in higher education, the increase in percent of people with high school degrees is hidden by those who are also attending college and universities. This is also a result of the changing societal norms toward the end of the time period.
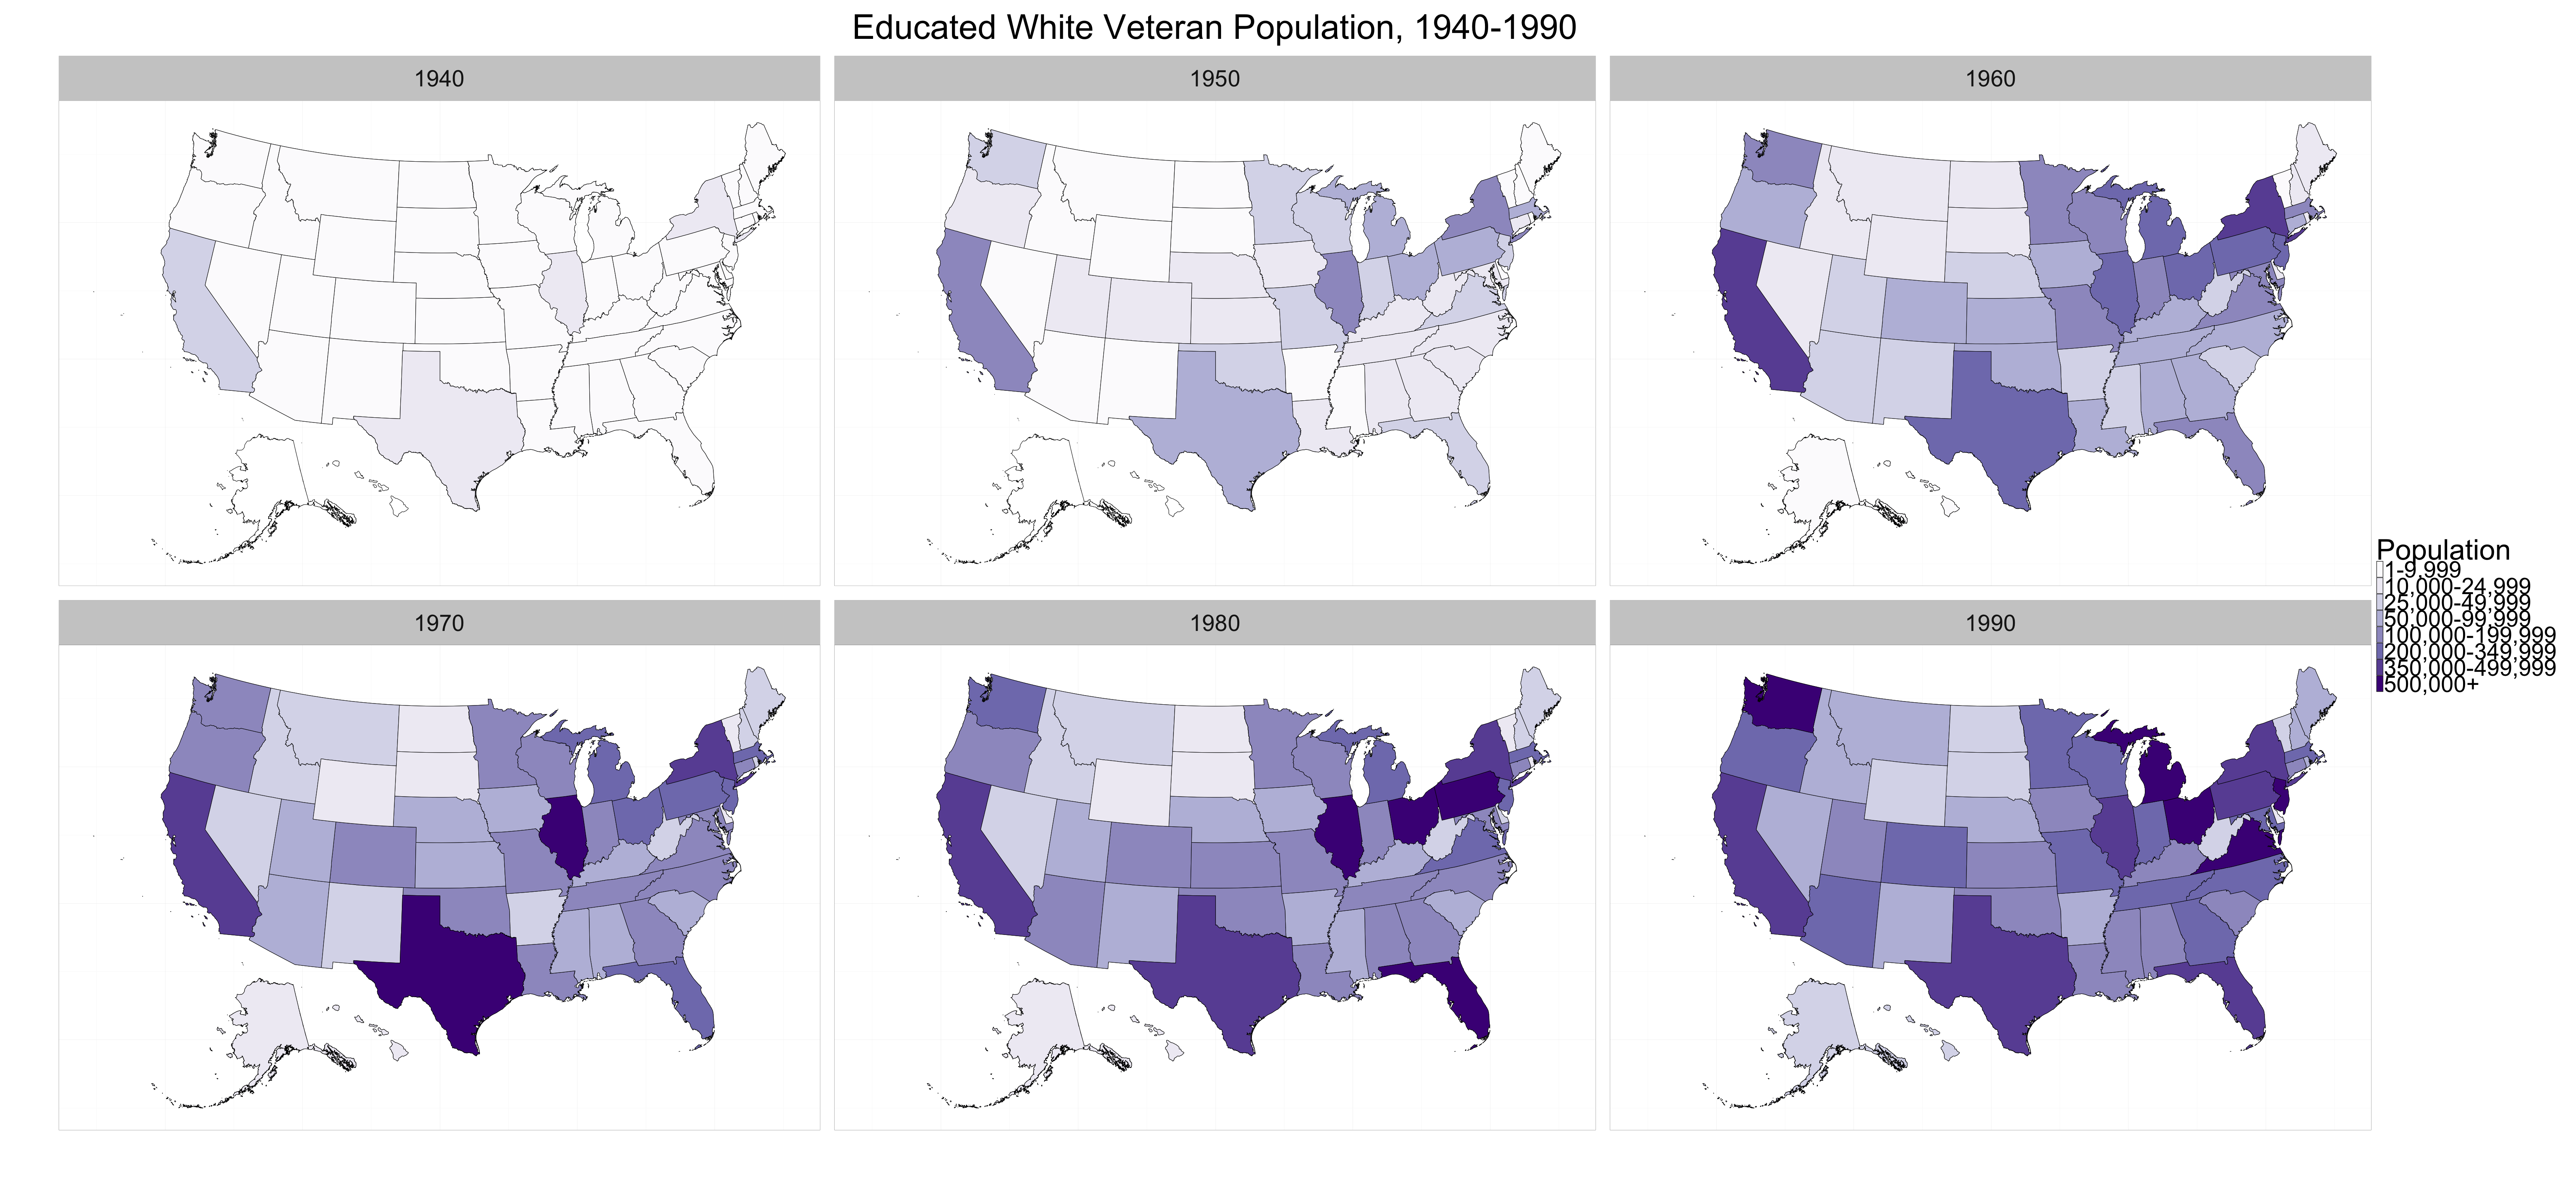
Figure 4 – Educated White Veteran Population by State
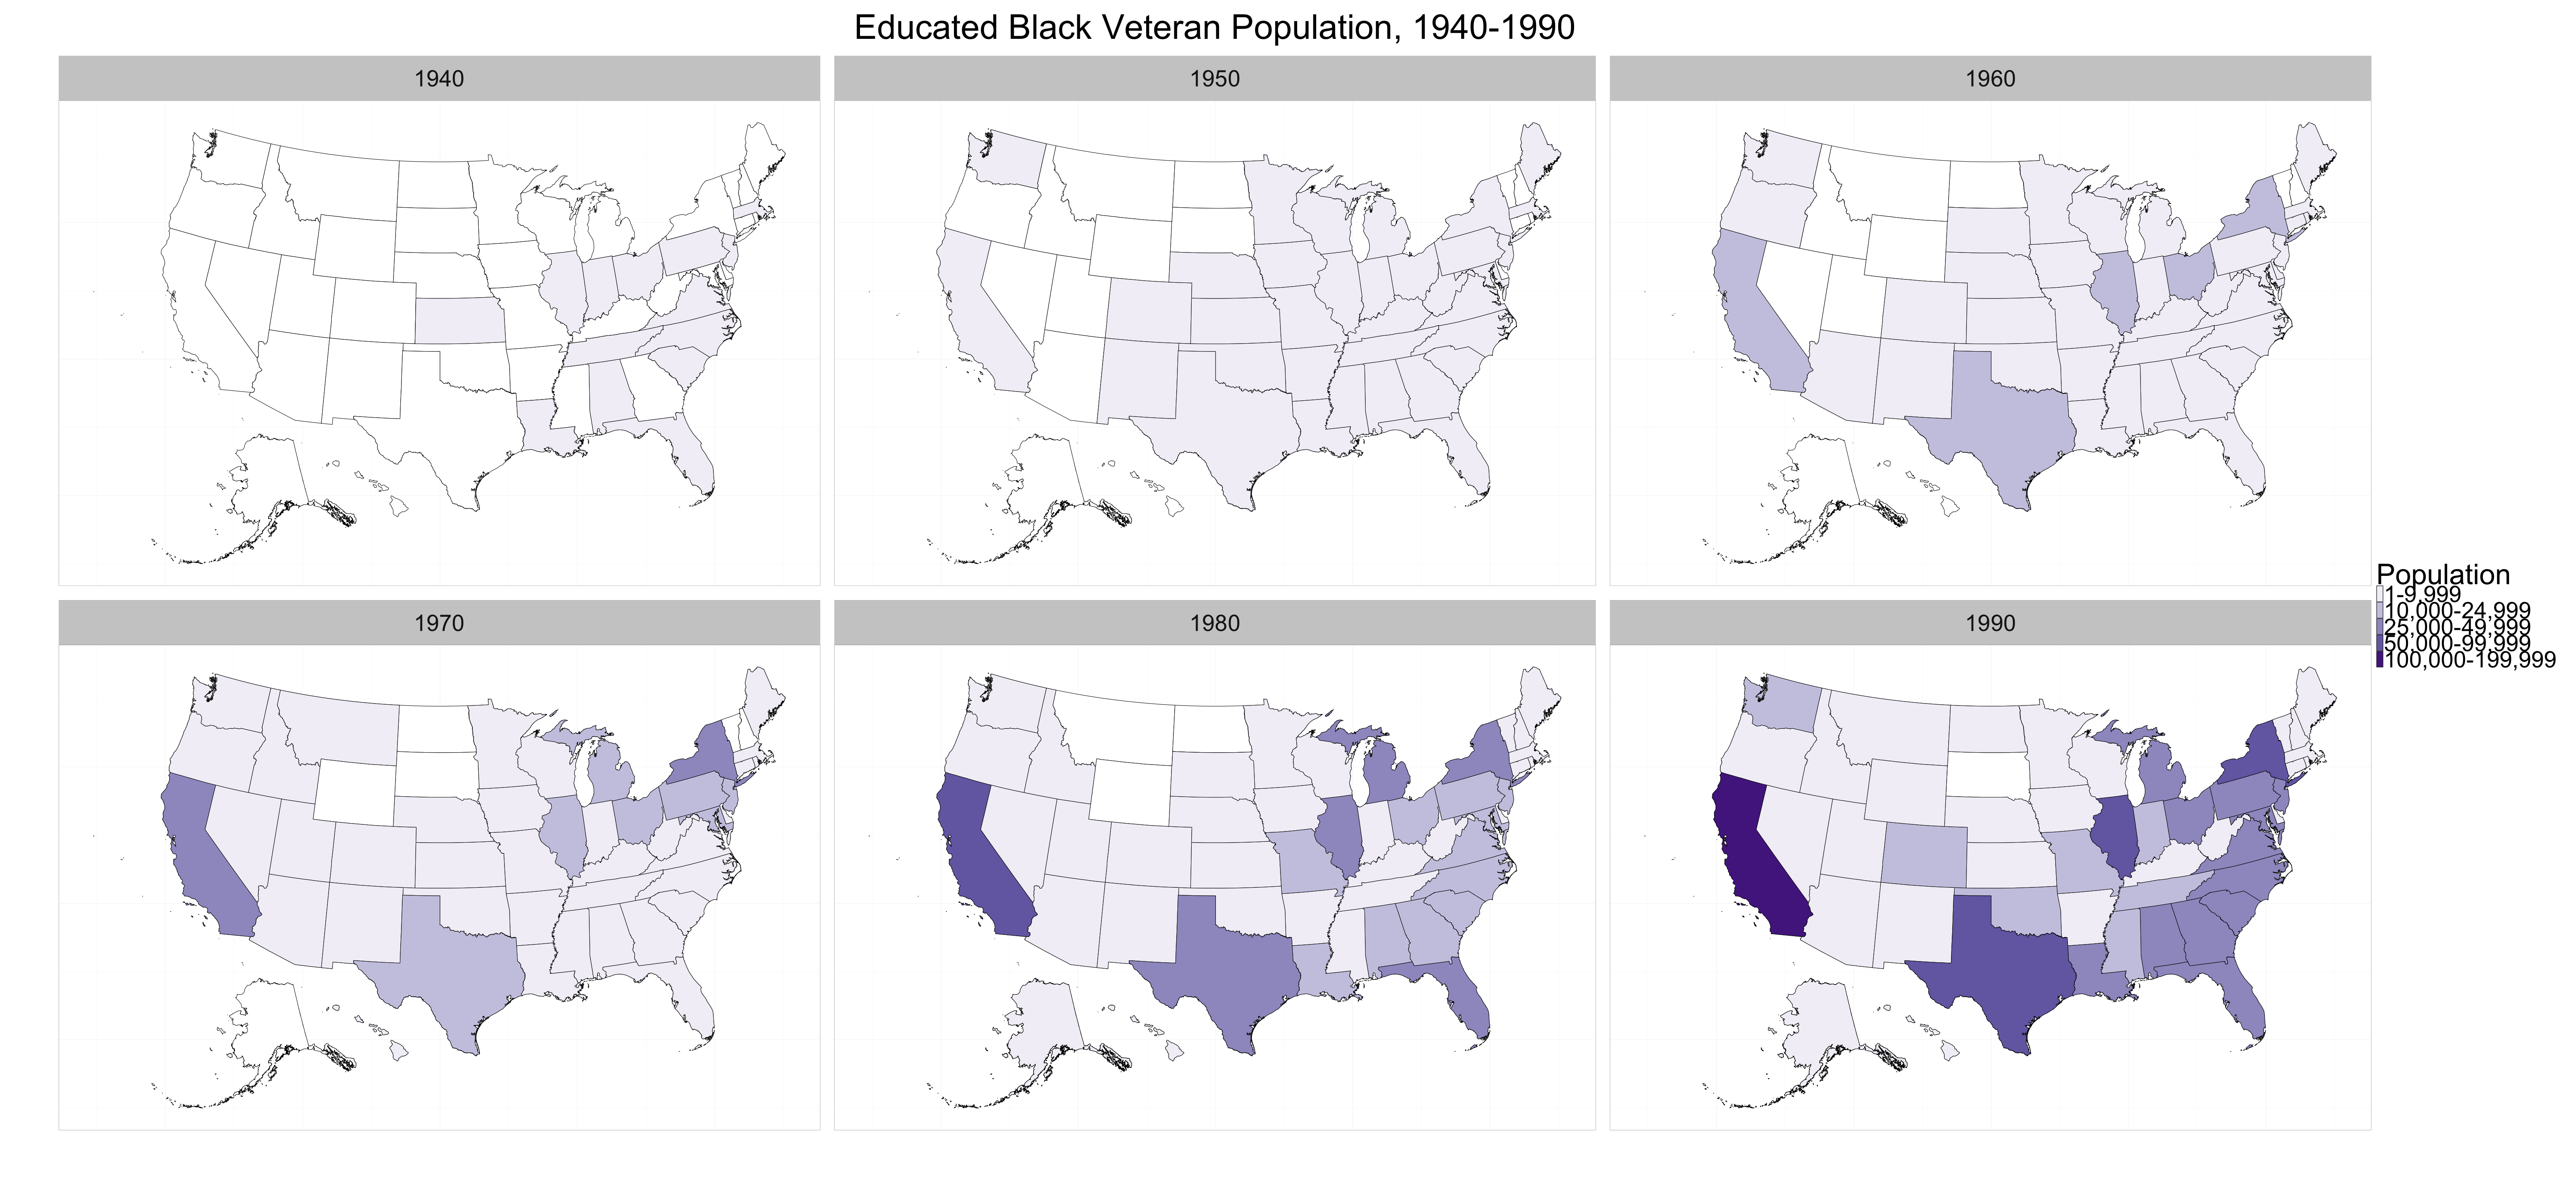
Figure 5 – Educated Black Veteran Population by State

Figure 6 – White Veteran Population by Education Level and by Region
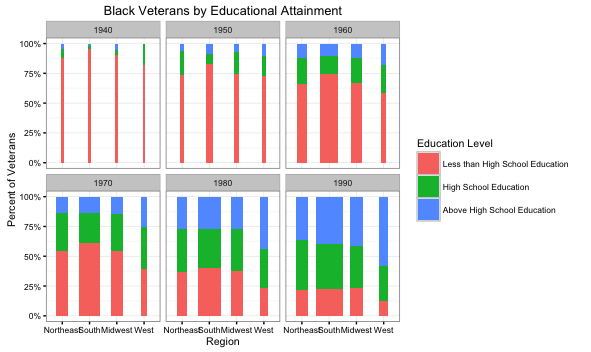
Figure 7 – Black Veteran Population by Education Level and by Region
Figures 4, 5, 6, and 7 all show extremely important trends pertaining to the claim about veteran’s location being a key factor in the efficiency of the GI Bill for the two races of veterans discussed. All four visualizations prove that the effectiveness of the GI Bill was, in fact, dependent upon location, at least from the 1940 census until the 1970 census. Figures three and four show the population of the educated veterans based on each state. When this data is analyzed alongside figures six and seven, one can see that up until 1980, it was much more difficult for black veterans to get a higher education than it was for white veterans in the South compared to any other region. The works written by Turner and Bound and Altschuler and Blumin all support this finding. However, this trend declines as time goes on. I accredit this development to the Civil Rights movement and the rise of institutions like junior colleges, more commonly known as community colleges (Thelin, Edwards, and Moyen 2016).
A final trend that should also be taken into account when analyzing the developments for black veterans is a trend that is shown by all the data visualizations. The number of black military members and their average level of educational attainment steadily increase as time goes by. Although it is true that the GI Bill’s impact was not racially equal throughout its existence, it did in fact affect the black veteran population quite dramatically. The timing of the major percentage increases shows that the usage of the aid that the bill provided was largely dependent upon the racial and educational norms of the regional area that surrounded each individual veteran. As the society changed, so did the ability to use the GI Bill.
Conclusion
The trends shown in the various data visualizations not only support the information presented by Turner and Bound, Altschuler and Blumin, and Browning, Lopreato and Poston, but also suggest important conclusions about later additions to the GI Bill. Overall, the figures show that the location of the veterans played a large role in determining the ability of black veterans to use the aid provided by the GI Bill. The data also shows that over time, the GI Bill becomes more easily utilized by black veterans, which I have attributed to the changing racial norms following the Civil Rights movement and the effort made by the government to increase funding in higher education institutions and programs during the Cold War Era. However, the amount of research available on the effects of the extended GI Bill is severely limited for the time period after the World War II. Although as written, the bill was never a discriminatory piece of legislation, the aid was distributed unequally between races from 1940-1960. With the Civil Rights movement and the changing government policy during the Cold War era, the society started to change, and black veterans were more free to take advantage of the GI Bill.
Works Cited
Altschuler, G. C., & Blumin, S. M. (2009). The GI Bill: A new deal for veterans. Oxford: Oxford University Press.
Browning, H., Lopreato, S., & Poston, D. (1973). Income and Veteran Status: Variation Among Mexican Americans, Blacks and Anglos. American Sociological Review, 38(1), 74-85.
Dortch, Cassandria. “GI Bills Enacted Prior to 2008 and Related Veterans’ Educational Assistance Programs: A Primer.” Congressional Research Service(2016): 7-9. Web. 10 Oct. 2016.
Thelin, John R., Jason R. Edwards, and Eric Moyen. “Higher Education in the United States.” Colleges, Institutions, Universities, and American History. N.p., n.d. Web. 11 Nov. 2016.
Turner, Sarah, and John Bound. “Closing the Gap or Widening the Divide: The Effects of the G.I. Bill and World War II on the Educational Outcomes of Black Americans.” (2002): n. pag. Web.