

Slavery is one of the most highly researched and talked about institutions in America. The effects of slavery can still be felt today in many parts of American society. This post focuses on how slavery has culturally affected the African American population in comparison to the white population. Many abolitionists believed that slavery permanently damaged the African American population due to sexual abuse, slave breeding, and other horrible acts practiced by slave owners (Mintz and Kellogg, 1988, 67). More importantly, abolitionists also claimed that slavery destroyed family life in the African American population due to the undermining of slave parents and frequent breakups of families because of the practice of buying and selling slaves/family members, and the illegitimacy of slave marriages (Mintz and Kellogg, 1988, 67). Mintz and Kellogg prove in their book, Domestic Revolutions: A Social History of American Family Life, that many of these allegations made by abolitionists were not in fact true or too extreme. While the effects of slavery have not been as extreme as many people think, I believe that there must have been some affect on the African American population culturally, especially compared to the white population. In this post I focus on the marriage rates within the adult African American population compared to the white population from 1870-1970 in order to see if slavery has effected marriage practices in the African American community.
Data
I gathered data from the Integrated Public-Use Microdata Series (IPUMS) for this project. I included 1% samples from the years 1850-1960. I used the RACE, AGE, REGION, PERWT and MARST variables from these samples for my research. The PERWT variable represents the sample weight of each individual. I separate the RACE variable into ‘white,’ ‘black,’ and ‘other.’ The ‘white’ category includes the white population of the United States which incorporates most European immigrants as well as Mexican immigrant until the early 20th century. The ‘black’ category encompasses all persons that reports themselves as black as well as those who were classified as mulatto (In the census from 1850-1930), quadroon or octaroon (In the census from 1890-1930). The REGION variable indicates the region where each individual is currently living during the year of that census. I have grouped the regions in the West, Midwest, South, and Northeast for this project. The MARST variable denotes the marital status (married, divorced or separated, widowed, never married) of the individual.
Methods
I graphed the ‘black’ and ‘white’ populations from 1850-1970 by region using marital status as the filler for the bars. I targeted the portion of the population of marrying age and excluded those too young to be married (less than 20 years of age) and the elderly (I believe they might skew the data with higher rates of widowing). I created two graphs that illustrate this data in which each race and region has its own graph. Each region and race category is laid out next to each other in order to see how they differ. The first graph represents the total data as it is whereas the second graph displays that data as percents of the total in order to see which marital status is most common. Both graphs include men and women. The code used for this project can be found here.
Results
Figure 1
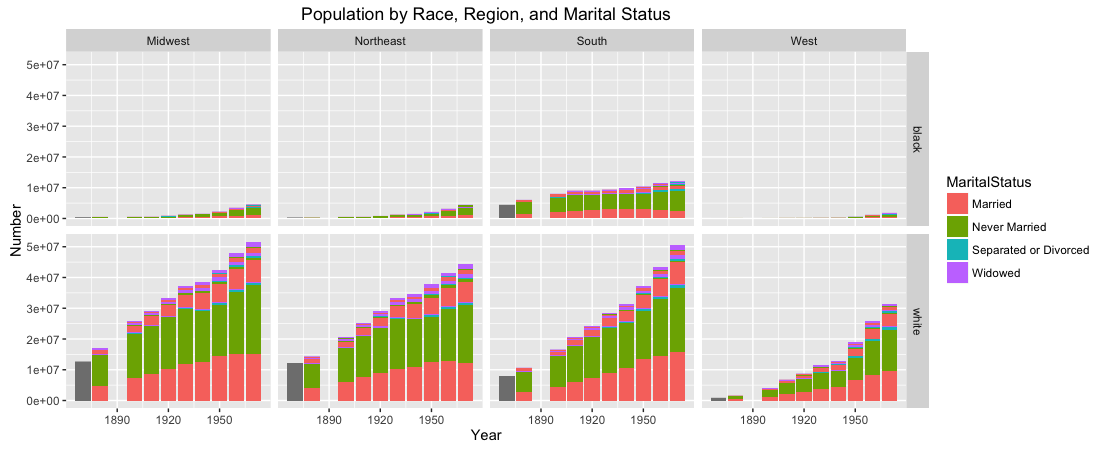
Figure 1 shows the total populations of the United States from 1850-1970 by region and race with marital status as the fill for the bars. Clearly the ‘white’ population is far greater the the ‘black’ population in each region with regards to total numbers. It is difficult to discern wether or not marriage rates are higher in the ‘white’ or ‘black’ population from viewing the total populations. There is not much to see regarding the ‘black’ population, but the ‘white’ population is large enough and grows enough each year to see changes in it. The ‘Widowed’ and ‘Separated or Divorced’ categories do not have a significant impact upon the ‘white’ populations in this graph. In the West and South, the proportion of ‘Married’ to ‘Never Married’ individuals remains constant over the time period. In contrast, the ‘Never Married’ category becomes a larger portion of the population in the Northeast and Midwest in the ‘white’ population.
Figure 2
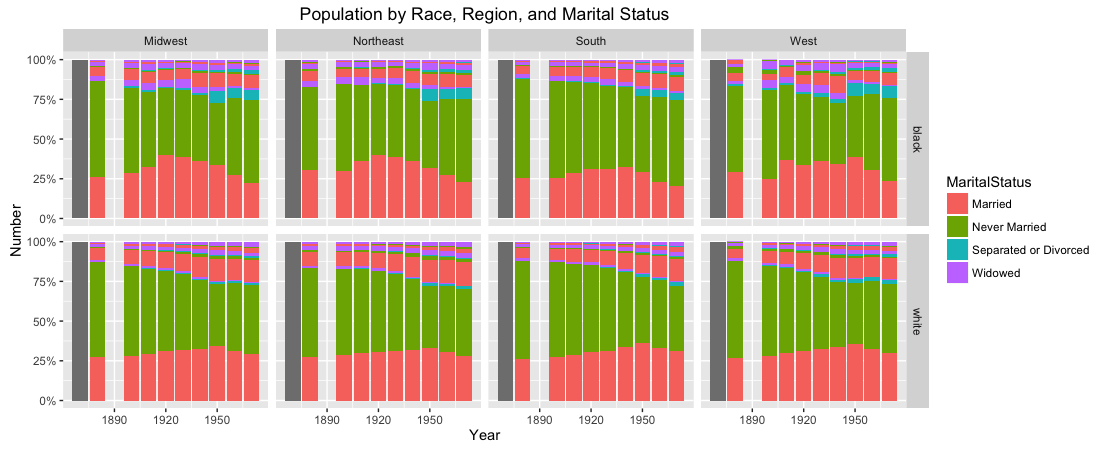
Figure 2 displays the ‘white’ and ‘black’ populations in each region showing what percents of the populations fall into different marital status categories. This graph more clearly shows the marriage rates of each racial population and how they differ. The ‘Widowed’ and ‘Separated or Divorced’ categories remain a small fraction of the population. In the ‘white’ population, these two categories maintain their insignificant percentage over the time period. In contrast, the ‘black’ population has a sudden spike in the ‘Separated or Divorced’ category in all regions in 1950, placing it above the percent of the ‘white’ population that falls into that category, and maintains that level for the rest of the data. The ‘black’ population also has a marginally greater ‘Widowed’ percent of their total population in comparison to the ‘white’ population in each region. In opposition to the ‘Separated or Divorced’ category, the ‘Widowed’ category decreases in 1950 and remains at a lower percent through 1970. It is much easier to read the trends of the ‘Never Married’ and ‘Married’ categories. In each region, the ratio of ‘Married’ to ‘Never Married’ individuals is greater in 1970 than at the beginning of this period. There is a steady decline of the ‘Never Married’ category in the ‘white’ population, with a slight resurgence in 1960 and 1970. The ‘black’ population also shows a steady decline in the ‘Never Married’ category and an increase in its ‘Married’ group until 1940 when that trend reverses. The ratio of ‘Married’ to ‘Never Married’ individuals in the ‘white’ population is noticeably greater by 1970, but was practically equal for the first half of the 20th century. These patterns are found in each region.
Conclusions
These results do not follow the claims made by abolitionists. The percentages of each marital status within the ‘white’ and ‘black’ populations are more or less equal from the emancipation of slavery up until 1950 when the ‘black’ population gains a greater percentage of people who have never married. From this we can conclude that the institution of slavery did not culturally make the ‘black’ population differ from the ‘white’ population in America with regards to marriage. The ‘black’ population diverges from the ‘white’ population with regards to marital status starting in 1950 and continuing through 1970. I do not think that this change in the data can be attributed to a late result of slavery. If slavery had made the ‘black’ population view marriage differently than the ‘white’ population it would have immediately created a noticeable disparity in marriage rates starting in the 19th century. A contemporary cultural event must have affected the ‘black’ population in America to start such a change. Seeing that this began in the 1950 census, it is possible that WWII could have affected the ‘black’ population in such a way. Furthermore, the civil rights movement, while it began in earnest during the 60s, may have been starting since the end of WWII and could have affected the ‘black’ population with regards to marriage rates. These are only two guesses at why the change in data I found occurred. For the purposes of this post, the data has illustrated that the institution of slavery did not seem to affect how marriage was culturally viewed by the ‘black’ population compared to the ‘white’ population in America following the civil war.
Works Cited
Mintz, Steven, and Susan Kellogg. Domestic Revolutions: A Social History of American Family Life. New York: Free, 1988. Print.