A total of 23 South Africans, from 10 different areas were interviewed. Each individual was interviewed and asked to give 3 words to describe baboons, in an attempt to gage perceptions of baboons. The words were then rated as negative, neutral, or positive. Each responder was then assigned a net score on a scale from 1 through 7, 1 being most negative, to 7 being most positive. Scores were calculated by setting 4 as the neutral starting base, and then every negative word subtracted a point, every neutral word added zero points, and every positive word added a point. Net scores were then assigned net perceptions, with 1 and 2 as negative, 3-5 as neutral, 6 and 7 as positive. Click here if you want to see the raw data tables.
Perception Map
This map shows where in South Africa the people I interviewed were from. Responders are listed by their occupation to show possible bias in their responses as a result of the nature of their work. The numbers in parentheses are their net scores.
Icon colors correspond to net scores with the three words that they used to describe baboons listed in the descriptions.
Red icons indicate more negative perceptions. Green icons indicate more positive perceptions. Yellow icons indicate neutral perceptions, some of which are greener or redder to indicate a mixed response.
Zoom in and click on icons to explore responses.
Based on the map I constructed, I did not find strong enough evidence to conclude that any particular region of South Africa has a more positive or negative perception of baboons. I had hypothesized that perceptions would vary based on how closely baboons and humans share habitats in those areas. I expected that the Cape Peninsula region would have more negative descriptions of baboons given the media focus, the overlap in habitat, and the volume of research conducted in that area regarding baboon management. I was unable to interview people who lived deeper down the peninsula where there more regular conflict, but responses I gathered near Johannesburg indicated that people there think slightly more negatively about baboons than people I interviewed in the Cape Region.
Although my results regarding geographic bias were inconclusive, I did find new information that people presented during the interviews interesting and surprising. Some people would mention problems with baboons in other areas of the country, even if they did not feel that their area had issues with baboons. One individual specifically referenced the struggle with baboons in Cape Town, even though they had never personally experienced conflict with baboons in their area. The person then used more negative words to describe baboons based on what they knew of Cape Town. It seems that people based their perceptions off of what they have heard about baboons in addition to their personal experiences. Many responders also identified their occupations as reasons for the words they would use. Responders would preface their comments with "As a farmer..." or "As a researcher..." which lead me to include information about their occupations in the map. Academics in particular were more likely to have strongly positive views of baboons.
Perception Data
The most responders (43.5 percent) had a net neutral perception of baboons. The net neutral category included three net score values as opposed to two so it was a larger category overall. However, the larger category still reflects a level of mixed feelings towards baboons on the responder's part that would not place the person solidly in the negative or positive perception category. 39.1 percent of responders had negative net perceptions of baboons, over twice as many as the 17.4 percent of responders with positive net perceptions. However, the difference between neutral perceptions and negative perceptions is only 4.4 percent, which equates to a difference of one person with such a small sample size. Negative perceptions are still not dominant. 60.9 percent of people, a clear majority, perceive baboons positively or neutrally. To see data broken down further view the Histogram of Net Scores.
Although more responders had neutral net perceptions, negative words (46.4 percent) were used to describe baboons more frequently than positive words or neutral words. The most common descriptions words were, "Dangerous," "Scary," "Naughty," and "Aggressive," which are all rated as negative.
To see data broken down further view the Count of Words By Rating
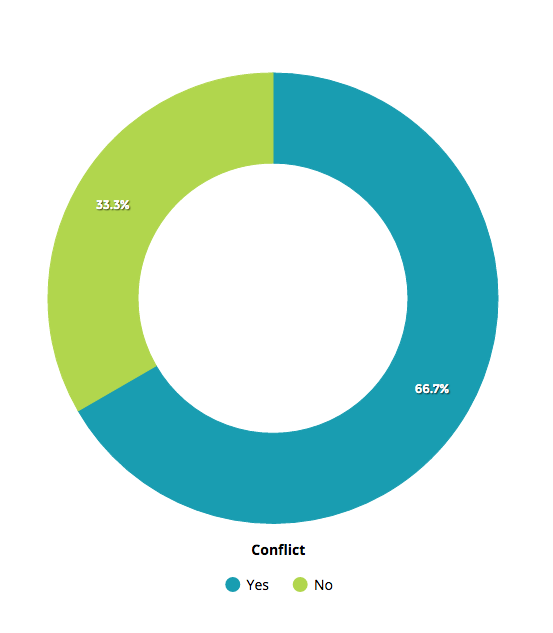
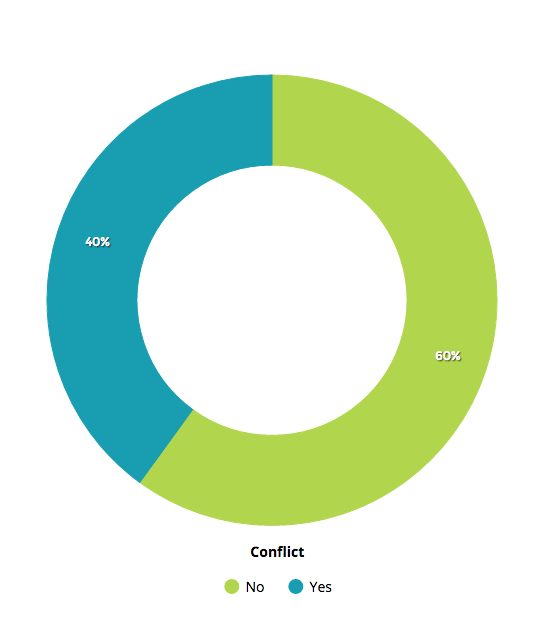
The majority of people interviewed (55.1 percent) have personally experienced conflict with baboons. But when conflict is broken down by category of response, results indicate that experience with conflict does not seem to necessarily correlate with how people perceive baboons. The majority (60 percent) of people who perceived baboons neutrally have not personally experienced conflict with baboons, which is expected given that those people also might not have enough information to form a strong opinion about baboons. In contrast, prior experience of conflict does not serve particularly well as an indicator or driver of negative or positive perception. 66.6 percent of people who used negative words in their responses had experienced conflict, but 75 percent of people who used positive words had also experienced conflict. People who have experienced conflict with baboons and still perceived them positively also seemed to also be people that have had exposure to baboons in a variety of capacities, not just as adversaries, in their work as researchers or guides in the field.

Conclusions
From these results I conclude that South Africans have very mixed perceptions of baboons, with no one perception leading strongly over the other viewpoints. The data I collected may not be fully representative of the larger South African population due to a more positive leaning bias in my sample population. But there does seem to be a more negativity towards baboons in the dominant narrative people use discuss the animals. The findings show that people are more likely to feel neutrally towards baboons if they have never experienced conflict with baboons, but other prior experience of conflict is not necessarily the driving factor influencing perceptions of baboons towards a particular direction. Baboons are complex animals with a broad range of abilities and set of behaviors so many people used a mixture of positive, neutral, and negative words to describe baboons based on a variety of encounters, observations, and information they have heard about baboons.
My results have not necessarily directly shed light on how perceptions might influence management strategies to mitigate human-baboon conflict, as I initially hoped for. However, it seems that the conflict between humans and baboons might not be as intense as headlines in the media make it out to be. Baboons are not as widely perceived with animosity which could indicate that people would be more receptive to various management strategies that minimize physical harm and are less combative toward baboons. Perceptions are not overwhelmingly negative as I initially hypothesized, and more responders felt neutrally to positively about baboons than negatively.
New Questions
Given that prior experience of conflict did not necessarily prove to be a clear influence on whether people had negative or positive perceptions of baboons, it would be interesting to see if media could be a stronger driver for influencing perceptions since some respondents based their answers on information they have heard from others about baboons, and one responder chose descriptions that reflected a positive and defensive description of baboons given the unjust reputation they felt baboons have retained. In a possible future experiment, a treatment group could be given a news article to read about human-baboon conflict and then asked for words to describe baboons which could then be compared to my original group which would serve as a control group.