

Introduction
Historically, there has always been wage gap between men and women and it is still a controversial topic in contemporary era. Many scholars have argued that there are several critical factors attributed to the differences in wage between men and women. And the study shows how several factors, the marital status, the number of children in family, and highest level of education influence on the wage gap between men and women. Several scholars in women’s studies find that the trend of women’s labor force participation shows noticeable differences not only by sex but by race. White and Black women who have similar education levels and number of children sometimes had quite different qualities of lives with varied socioeconomic status. There are significantly many factors to determine an individual’s life. The trends in lives of different races written in history might be colored or slightly distorted depending on the authors of history references. So, through these activities, I would like to quantitatively prove or disprove that races, genders, education levels or other demographic factors affected an individual’s quality of life in terms of the amount of wages or groups of available occupations from 1940 to 2000. I also expect that although my analysis focuses on data collected between 1940 and 2000, I would be able to find the patterns defining the relations of various demographic factors recorded from the far past, and possibly guess how lifestyles of individuals in society of the 21st century would be changed. I would like to examine whether my initial assumption which indicates that low education level and the number of children in family would decline women’s income more than women with higher education level or with no children turns out to be true. So, with comparative analysis, First, I would like to show how different demographic factors such as age, genders, marital status, education levels, number of children in family and more variables could affect amount of wages and kinds of available occupations. And, second, I want to conduct a research on how strong or weak each of these demographic variables would be related, and how classification of occupations by various demographic factors could reflect the overall demographic interpretation from 1940 to 2000.
Methods
Data cover the years from 1940 to 2000 and the raw data for all graphs are obtained from IPUMS 1% samples (1% state fm1 for 1970 and 1% metro for 1980) and the data before 1960 from Alaska and Hawaii are excluded since data are not available for Hawaii and Alaska from 1940 to 1960. The marital status is classified as married, not married (widowed, separated, divorced) or never married status, and the education level is classified as the education level of nursery school to grade 4, grade 5 to grade 12, 1 to 4 years of college or higher, or no schooling. The data are weighted by PERWT, except for the data for Figure 3, which is weighted by HHWT.
Figure 1
This box plot shows the income of people of age 20 to 40 from 1940 to 2000. The figure shows 10th, 25th, 50th, 75th, and 90th percentile of income of white and non-white people sorted by same sex of each race. The currency is in 1999 dollars and income has been adjusted with IPUMS CPI99 and the Census top-coded income in all years from 1940 to 2000. For consistency of analysis, I have applied the lowest top code ($5001 in 1940 dollars; $59,941.99 in 1999 dollars) to incomes in all years. This variable is weighted by person weight (PERWT) for all years except 1950 for which income is weighted by sample line weight (SLWT). The Race categories of these visualization data include white and non-white people. The x-axis shows year and the y-axis represents median income dollars of the same sex of people of different races.
Figure 2
The bar graph shows the number of children of women aged between 20 to 40 from 1940 to 2000. The figure shows 4-year college or higher educated and less than 4-year college educated white women. The x-axis shows year; y-axis represents proportion of the percentage of number of children women have in each year. This bar graph indicates the relation of the number of children, ages, educations levels by different times.
Figure 3
The line graph shows the median income of white women aged 20 to 40 by their marital status and number of children in 1940 to 2000. The currency is in 1999 dollars and income has been adjusted with IPUMS CPI99 and the Census top-coded income in all years from 1940 to 2000. For consistency of analysis, I have applied the lowest top code ($5001 in 1940 dollars; $59,941.99 in 1999 dollars) to incomes in all years. This variable is weighted by person weight (PERWT) for all years except 1950 for which income is weighted by sample line weight (SLWT). The race categories of these visualization data include white and non-white people. The x-axis shows year and the y-axis represents median income dollars of same sex in different race of people. Here, we can see that regardless of what marital status both parents have, the number of children in family impacts a lot on wage gap between different groups of couples by their family structure.
Figure 4
The bar graph shows the occupations of white people aged 15-65 by sex from 1940 to 2000. This graph portrays the labor division trends among men and women throughout this period.
Result
From the visualization data, I can see how women’s marital status, the number of children in family, and education level can differentiate women’s social roles and status in society by race and sex.
Code for figure 1 is available on Github
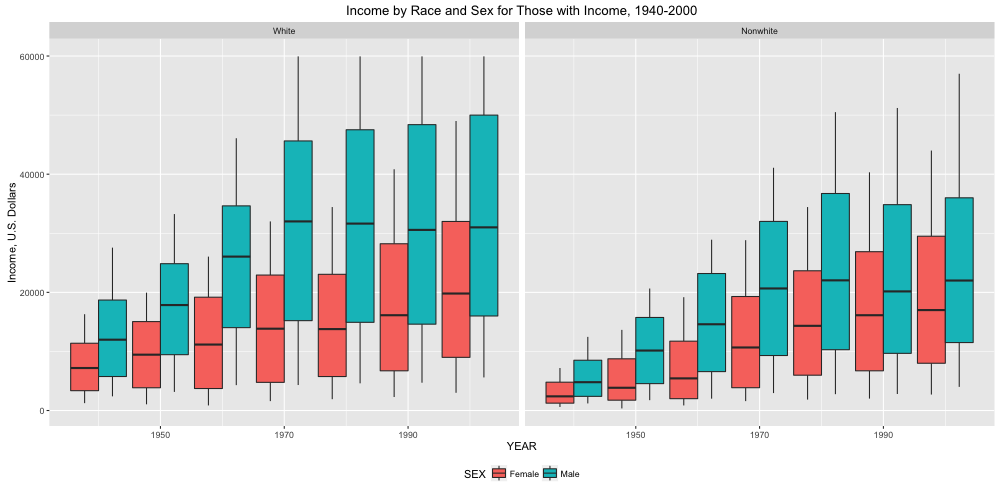
Figure 1 shows the income difference between white male and female and non-white male and female by year
The figure 1 simply shows unequal wages earned by white and nonwhite men and women by sex and race. Each figure represents the amount of wages by white and non-white populations. We can find that in 1940s, the wages earned by white are much greater than those earned by non-white population, but in 2000, the gaps between two populations got smaller. As expected, regardless of their own sexual identity, white people typically get higher income than non-white people. The graphs indicate that for male population, white people consistently earned more money than non-white people while for female population, in 1950, white and non-white population earned very similar amount of wages and even in 1980s, the amount of wages for non-white population was slightly beyond that for white population. The increasing number of women’s involvement in labor movement played significant roles in bridging wage gap between women and men by their education level and marital status. In Great Depression, women’s traditional roles as mothers who predominantly manage housework could not be maintained as before. Many men lost their jobs and lack of usual male providers lead women to go out of house and work to pay. Before the World War I, increasing trend in female involvement in labor was considered as unfortunate and not feminine things, and as non-white women’s work in poorer class. However, in 1920, unmarried female officers were glamorized and a new ideology about female involvement in labor was formed (Sara, 1989). In labor population, one quarter of female workers of age 16 or more, worked, and in 1920s, 30 % of female workers were engaged in office jobs and sales marketing. Mainly, office jobs were highly positively considered as white collar class, and most of white women occupied these positions. Such office jobs gave opportunities to form a new ideology of society saying that women could work outside but, still, professional jobs which women quite positively evaluated from the end of 19th century to the beginning of 20th century. At the turning point of the 20th century, most of office jobs were occupied by male workers. Yet, overall change of life in 1920s was successful in leading women into individualistic atmosphere of consumer economy, and the separation of housework and outside work which formed traditional middle class ideology of gender was barely recognized. This way, female social reform brought the foundation of welfare country in 1930s. The Great Depression in 1929 distressed many families whose socioeconomic status were determined and fixed by occupations and the amount of wages of male heads in families. In this period, male gender role could not be easily implemented by earning money to support family. Black women could not get jobs in manufacturing industry and, instead, started home working (Margaret, 1993). Therefore, between 1930 and 1940, home working increased by 25 % and most of workers engaged in home working were Black. In 1930s, 55 % of all home workers were non-white and in 1940s, this proportion reached 64% or two thirds of total workers (Sara 1989, 311)
After baby boom occurring from 1940s to 1950s, the fertility rate reached the lowest point at the end of 1960s. After World War II triggered many women to enter the labor market with economic necessity, some women aspired for upward mobility in economic world, but, most of their voices were unheard since women were considered as “disenfranchised appendage” to men (Pettigrew, 1974, 72). From the end of 19th century to the beginning of 20thcentury, discouraging working conditions and environments motivated many female human right activists to participate in labor campaigns. From the beginning of the 20thcentury, female activists’ movement for civil rights and equal rights in the work place got more and more encouraged. In 1940s, almost 0.8 million female workers joined in labor union, and fought against the longstanding opinions arguing that female workers should work at home rather than in factory. This historical background shows that the traditional gender norm that men are more specialized in working in the labor market while women is more specialized in working at home became one of the critical factors which perpetrated the discriminated wage income between men and women. Men are more likely to be employed in high-skilled required and hence high-paying jobs and many times employers believed that men work more productively than women since they thought women are more suitable to feed and support their families at home. Since men were more occupied with high-wage jobs, proportionally, regardless their marital status or level of education attainment, women were more likely to be hired in low-paying jobs in the past, either they were forced to do so or by their will. In the beginning of 20th century, gender identity, rather than other socioeconomic status or aspects, became a crucial part which widen the wage gap between men and women than in the end of the century.
Code for figure 2 is available on Github

Figure 2 shows the number of children by women age and education level
Figure 2 shows the number of children by women age and education level
The figure 2 shows that differences in women’s education level and marital status not only by their race and sex influence on their fertility rates and eventually their working conditions. Women tend to receive more college and graduate degrees than men but female workers, on average, receive less wages than men (Chamie, 2014). The relation of ages and education levels resulting in the number of children. For women in age of 21 to 25, as the years go, the proportion of women with no children increase but women with no 4-year college or higher education have higher proportion of one or two children. As the ages go up, the proportion of one, two or more children consistently increase in both groups of women. For women of age 26 to 30, women without 4-year college or higher education have higher proportion of three or more number of children than those with 4-year college or higher education regardless of years. According to Pettigrew, women tend to believe that women are supposed to be economically reliable to their husbands and obey the traditional norm which says primary role of women is to take care of their family at home (Pettigrew, 1974). However, as women’s participation in labor market has increased during World War II with their economic necessity, they realize that they can also be significant contributors to economic growth and development of a country. The Federal Civil Rights Act of 1964 enforced a law prohibiting discrimination in employment between men and women, however, still there is a large gap in terms of their earning based on their sex (Pettigrew, 73). However, the Civil Rights Act did not necessarily help to decline the income gap between men and women. Marriage and childrearing have always been critical factors which affect the employment and the wage rate, especially for women. Also, Sara’s study shows that women with more children were paid less money than women with less or no children and even mothers were less likely to work in the paid jobs. In contrast to decline of married women’s labor force participation, however, married men with children are more likely to earn and work in the paid labor force than men without children (Sara 1989, 323). Hence, this phenomenon may become a potential factor which leads more women of higher education earners to postpone having babies compared to less educated women (Hoffman, 1974).
In addition to this, Eileen Patten argues that there is an income gap across different race and ethnicities. Even though white and Asian women narrowed the wage gap from 1980 to 2015, black and Hispanic women only earned almost no higher fare than before. The situation among black and Hispanic men is not the same as with women. The black and Hispanic men have not made much progress in narrowing the income wage between white men since 1980 (PewResearch, 2016). Some researchers predict this result is because of the lower education attainment rate among blacks and Hispanics than whites, since the U.S. workers with a four-year college degree earn higher wage than those who do not (Patten, 2016). However, the main problem is that people at the same education level earn different wages regarding to their race, ethnicities, and gender. For example, according to 2015 census data analyzed by the Pew Research Center, college-educated black and Hispanic men earn about 80% of what white college-educated men. And Asian college-educated women earn about 80% of what white college-educated men (Patten, 2016). In addition, figure 2 shows the median income gap between men and women which demonstrates that during the 1980s to 2000s, women’s income has been increased while men’s income has decreased. The graph show that there is noticeable growth in women’s earning as the period reaches to the end of 20th century, whereas men’s earning slightly decreased and increased again in 1990s. According to Status of Women in the States, women’s labor participation rate increased largely from 1950 to 2014. The women’s labor participation rate has been increased from 33.9 percent in 1950 to 43.3 percent in 1970 (IWPR, 2015). Also, we can see that there is still gender based division of labor persists across the sector of employment. For example, employment in services such as health care, nongovernmental education, leisure, and other services are female-dominated, but only one in four men work in these industries. Also, the construction industry, manufacturing, and transforming and communications fields of employment are male-dominated even in the contemporary era (IWPR, 2015). The research addresses that there are many factors contributing to persistent wage gaps but they can be explained mainly by differences in education, labor force experience, occupation, or industry (Patten, 2016). According to a survey on racial discrimination by Pew Research, about 64% of blacks say black people are unequally treated in the workplace and especially less fairly than white people. On the other hand, only about 22% of white and 38% of Hispanic agree to this.
Code for figure 3 is available on Github
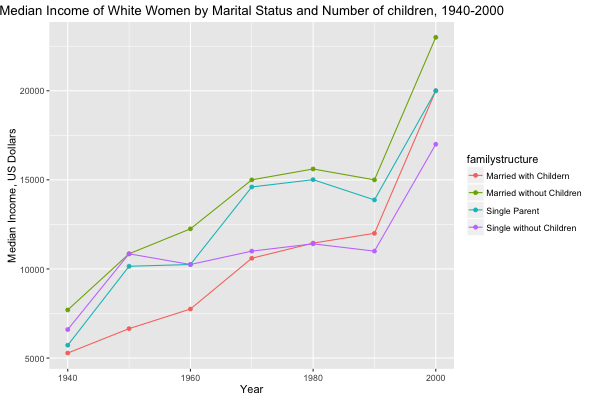
Figure 3 shows the income difference between women in various family structure
Figure 3 shows that women’s wage differences by their family structures. Single women aged 20 to 26 earn roughly 17 percent more than married women in 2015 (Chiodo and Owyang, 2003) From the studies, Chido and Owyang found that age and marital status influences on women’s wages. Several studies argue that there is not a direct link between wage and marital status but the timing of marriage and the wages are related to each other (Chiodo and Owyang, 2003). Timothy Chandler, Yoshinori Kamo, and James Werbel’s studies show that postponing marriage increases a women’s wage and it indicates that women’s early job experience before marriage affects the increase of their wage (Chandler, Kamo, and Werbel, 1994). In sum, the studies argue that employers tend to believe that young single women without children are more likely to dedicate to their companies than married women with children. Women tend to receive more college and graduate degrees than men but female workers, in general, receive lower wages than men. Women who married without children earn the highest income as compared to other groups of women who married with children, single with children or without. The proportion of married women without children tend to have better incomes than married women with children or single women with children or without children. The existing wage difference between married males and unmarried males can be partially explained by the result of a division of labor between husband wife. Historically, husbands were specialized in labor market work and wives were specialized in housework; married men are likely to be motivated to work harder to support their family (Blackburn and Korenman, 1994, 255). Many men and women attain higher education as time goes by, but still the income wage gap has not been bridged enough. And especially, women are hugely impacted by their fertility rates and marital status when they are employed.
Code for figure 4 is available on Github
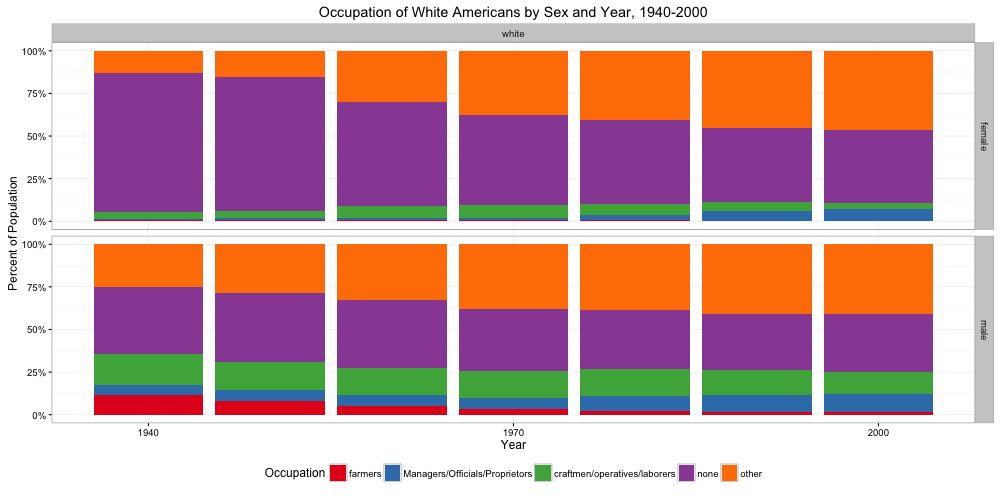
Figure 4 shows the labor division of white people by year and sex
Figure 4 shows that more than half of women did not have any occupation until the end of 20th century, and farmers, craftsmen, operative, laborers were predominantly male-dominated jobs. Women’s participation in labor market largely increased by the end of the 20th century, however, even today, gender based division of employment persists in the United States. Many American men work in construction, manufacturing, and transportation and communications industry (IWPR, 2015). Moreover, the proportion of women who were employed in professional or managerial occupations, such as lawyers, doctors, nurses, and teachers has increased since 2004 (IWPR, 2015). However, in general, women earn substantially less income than men in the same professional and managerial occupation. However, in general, women earn substantially less income than men in the same professional and managerial occupation. From this visualization data, we can assume that the occupational segregation between white and non-white people has been one of the potential factors that results in income inequality between men and women.
Conclusion
This project examined how some of critical socioeconomic features such as marital status, the number of children in family, or education achievement impact on differences in wage between men and women by race and sex throughout the 20th century. From the study, I could see that after the mid-20th century, the ratio of women’s labor market participation noticeably increased and women’s labor became more important. However, I also could see the certain pattern that came out with working women as she earned education degree, got married, and had babies. There were several literatures that support my initial assumption that married women with young children would have the low employment status and have low income jobs. Some literature explained the traditional gender norm and stereotypes in both men and women toward women caused more employers to hire men over women. Basically, women with young children barely had opportunities to have full-time jobs since they had to endure the burden came from working at workplace, doing housekeeping, and child-rearing. Hence, the literature I used support the idea that higher-educated and couples with no children were more likely to earn better wage than who were less-educated and with children. It made me see the pattern that traditional gender norm became even more strengthened as women got married and had babies. The graph of division of labor by sex and the noticeable division of male-dominated jobs and female-dominated jobs tell us that there were still stereotypical structures in industry where many industry sectors differentiate men’s jobs or women’s jobs. Even though making specific causal and effect connection between certain socioeconomic aspect and wage gap is still very complicated, the gender wage gap existed regardless of what race or ethnicity the person had. I think further research should focus on family structure by each year in 20th century and work on examining whether these patterns existing in the 20th century could be repeated in the 21st century in different formats of social structures.
Work Cited
- Pettigrew, L. Eudora, L. Thomas Keith, and Homer C. Hawkins. “Sex Discrimination and the American Labor Market: A Perspective.”Sociological Focus 1 (1974): 71-86. Web.
- “Changes in Women’s Labor Force Participation in the 20th Century: The Economics Daily U.S. Bureau of Labor Statistics.”S. Bureau of Labor Statistics. U.S. Bureau of Labor Statistics, n.d. Web. 01 Nov. 2016
- Evans, Sara M.Born for Liberty: A History of Women in America. New York: Free, 1989. Print.
- Hobbs, Margaret. “Equality and Difference: Feminism and the Defense of Women Workers during the Great Depression.” (1993). Web
- “Employment and Earnings – Women in the States.” Women in the States Employment and Earnings Comments. Web. 04 Nov. 2016.
- Patten, Eileen. “Racial, Gender Wage Gaps Persist in U.S. despite Some Progress.” Pew Research Center RSS. N.p., 01 July 2016. Web. 03 Nov. 2016.
- Chandler, Timothy; Kamo, Yoshinori; and Werbel, James. “Do Delays in Marriage and Childbirth Affect Earnings?” Social Science Quarterly, December 1994, Vol. 75, No. 4, pp. 838-53.
- Chiodo, Abbigail j. AND Owyang, Michael t. “Marriage, Motherhood and Money: How Do Womens Life Decisions Influence Their Wages?”, 2003.
- Blackburn, McKinley and Korenman, Sanders. “The Declining Marital-Status Earnings Differential.” Journal of Population Economics, 1994, Vol. 7, No. 3, pp. 249-70.
- Hoffman, Lois Wladis. “The Employment of Women, Education, and Fertility”, 1974.
- Chamie, Joseph. “Women More Educated Than Men But Still Paid Less.” YaleGlobal, 2014. Web.