

Introduction:
The changing roles and rights of women is an understandably well discussed topic. Through 1920-1970 women gained more freedom and more independence, perhaps most clearly shown by increased numbers in the workforce, granting women their own incomes. Slow increases in working population accompanied with big booms for the World Wars are well documented. It’s also been well tracked that non-white women work more, and work for less. A major topic with regards to women working in the 1900s was its effect on their family lives. At the time there was much discussion on the morality and propriety of working mothers. Overall, female employment has been well documented with respect to race and family values. By use of census data, these topics can be more clearly numerically supported and more specifically analyzed with regard to family values. Not just with what was considered correct at the time, but what was actually happening with regard to women’s employment, relationship status, and number of children.
The most well documented and data driven aspect of women from 1920-1970 was employment. The discussion of women’s employment is covered in all of my sources. There is a steady increase in employment across decades with a particularly large jump during World War II, and a minor downturn during the depression (Standlee, 2010). This is a very clear trend that I expect the census data to confirm easily. However, it is noteworthy that there were clear issues with the way women’s employment was recorded that I will consider during my research (Folbre, 1989). Women’s employment is the starting point that connects other aspects of this project.
Along with the challenges women already faced in the realm of employment we have to consider the intersectionality of non-white women. In addition to sexism, women of color faced racism. This affected both their positions and wages. As did the pressures and cultures they interacted with. Compared to white women they were more likely to work, typically in service based jobs, and made lower wages. It is well known that racism was very strong from 1920-1970 and unsurprising that women of color were worse off. From the beginning of this time period more nonwhite women, particularly black women, were working, so their employment rates did not increase as much as among white women (Feinstein, 1979, p. 84). Sources in this area always touch on race as well as gender because it is impossible to properly consider women of color without both.
Another ongoing trend in research on female employment is the relationship between it and family life. There are many books from the time and more currently, such as The American Woman, The New woman in the New Era, and Women’s Two Roles, that debated the pros and cons of female employment. The tendency of the census to under report women’s work came form a belief that they were homemakers first and likely not employed (Folbre, 1989, p. 547). Even in World War II when the government tried to rally women to work they did so by expanding the definition of home to the entire country so women would feel pressured to care for it (Standlee, 2010, p. 50). Between 1920 and 1970 the female workforce gradually shifted from mostly single women to mostly married women (Myrdal, 61). A very popular topic was if it was proper for mothers to work and be independent, having their own needs and interest outside of the household, or if this distracted them from raising their children well and caring for their husbands needs. This pattern of looking at female employment through the lens of family. A quantitative way to consider family life is not just whether women are married, but also if they have children.
Data and Methods:
The above figures were all created using IPUMS 1% samples of US census data, with 1% State fm1 used in 1970. Alaska and Hawaii were excluded as data from them are not available in all the relevant years. Percentages were calculated as total percent employed out of all women in that category, for example total employed single women between 16-25 in 1920 out of total single women between 16-25 in 1920. Totals were calculated using PERWT. Employment was determined using IPUMS’ OCC1950 variable. Divorced or widowed women were included as single. The IPUMS’ variable NCHILD was used to identify the number of children each woman had.
The first figure is a population pyramid of percent employment among married and single women from 1920-1970. Code for that figure is available here. The second figure is composed of two line graphs, one for single women and one for married women. Each line represents a different race group and traces percent employment according to US census data from 1920-1970. Code is available here and here. The third figure has two line graphs, again one for single women and one for married women, with lines for different numbers of children, tracking percent employment from 1920-1970. Code can be found here and here.
Trends and Analysis:
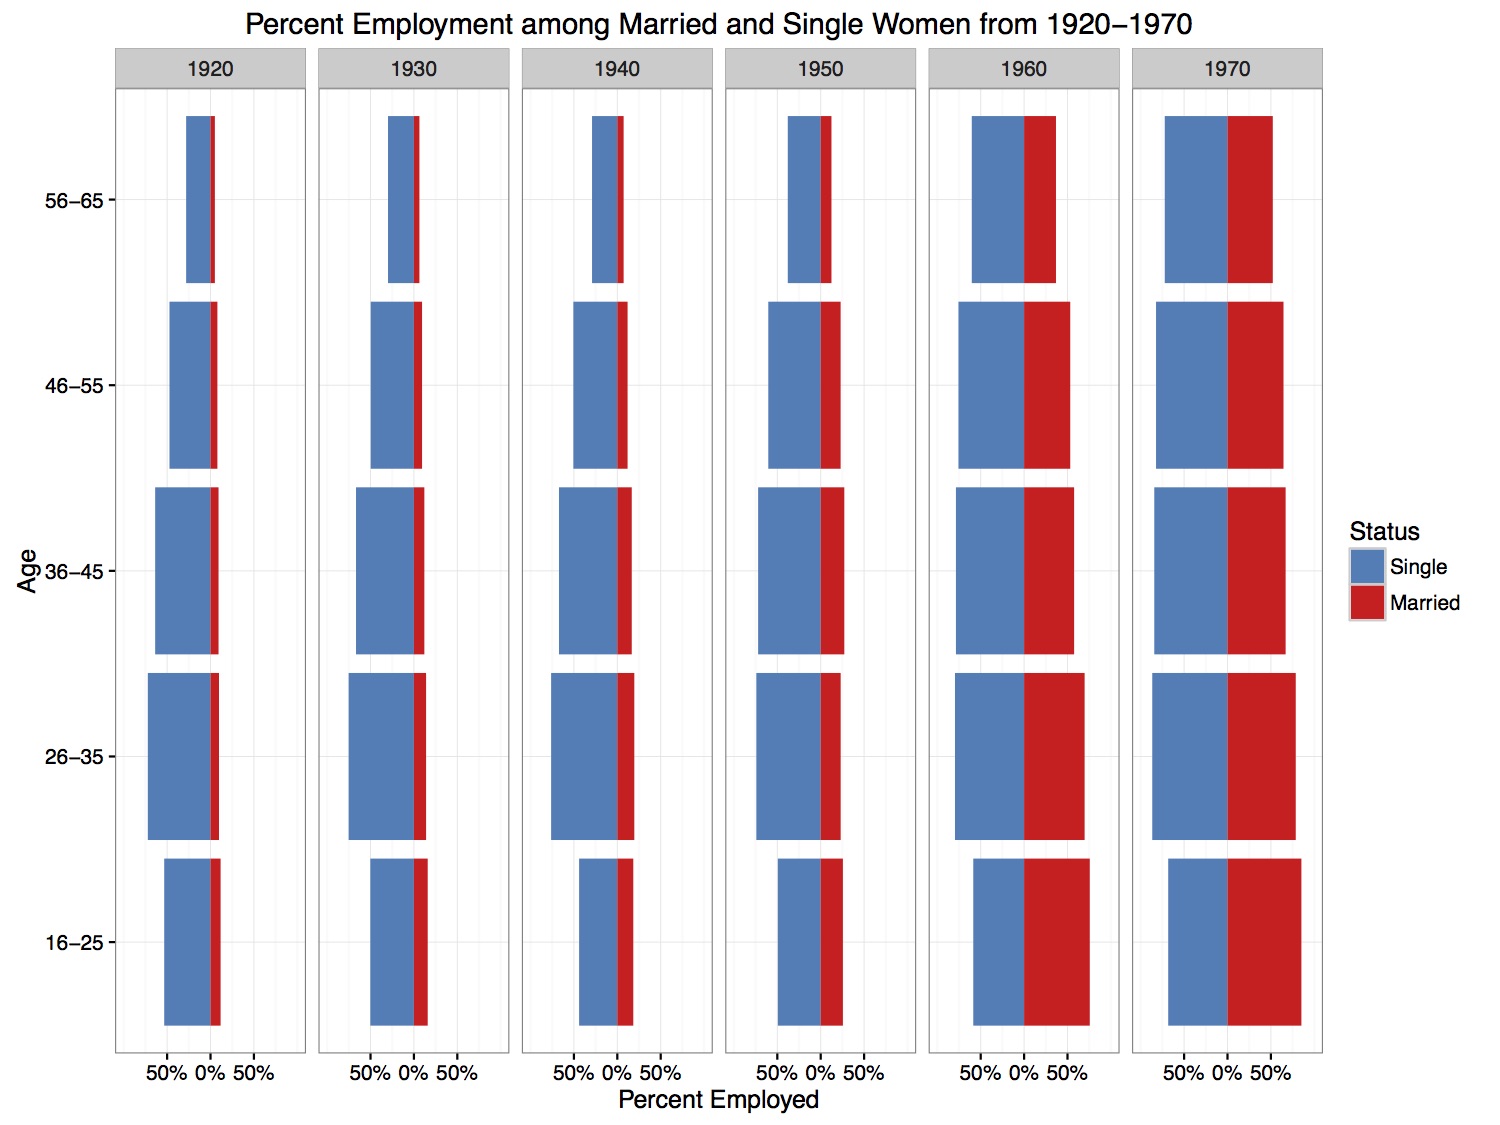
Figure 1: Population Pyramid of Percent Employment among Married and Single Women from 1920-1970
In Figure 1 from 1920-1950 we consistently see percent of working single women exceeding percent of working married women. This trend begins to level out by 1960. We see the largest percentages of working single women in ages 26-35, by far. Percentages of working married women appear more constant across all age groups within the same year.
The beginning prevalence on single working women is due to a need to support themselves without a husband and, as they aged, without support of their family. The later period where married women began to work more comes from a call to action during WWII (Standlee, 2010). This was a drastic, and extremely effective, move by the US government to attract more women into traditionally male jobs, now left open as men were shipped overseas. Women were needed for manufacturing jobs for the war as well as in general jobs to keep the country’s industry going. Interestingly, when the US government originally went about this campaign they played into traditional gender roles, even while trying to defy them. The call to help the USA was framed as a extension of the home. The idea was that by referring to the USA as ‘the home land’ or ‘our home’, women would view America as they did their own households, something it was their responsibility to help (Standlee, 2010). The intention of working women propaganda was never to permanently shift women’s roles; they were expected to work until the end of WWII and then shift comfortably back into their domestic hemisphere. However, these numbers never settled back down due to changing views of family and different attitudes of women (Feinstein, 1979). The largest group of working women being between 26-35 is likely due to women younger than 26 being supported by family. For unemployed single women we could postulate that women who were not marked as employed may have been working in a capacity the census didn’t mark down or living off an inheritance (Folbre, 1989). During the 1960s and 1970s for ages 16-25 we see the percent of married, working women exceeding percent working single women for the first time. This can be attributed to increased independence and rights for women, even those who married more traditionally at younger ages continued to work.
The consistent percentages of working married women seem to imply that woman who worked at one point during their marriage would likely continue to work throughout. This would match well with the idea that women’s employment was often determined by attitude and women, once they worked briefly, would continue to work. This could also be attributed to women who worked being married to men with lower wages; further analysis using census data of husband’s wages could be used to test if this was the case.
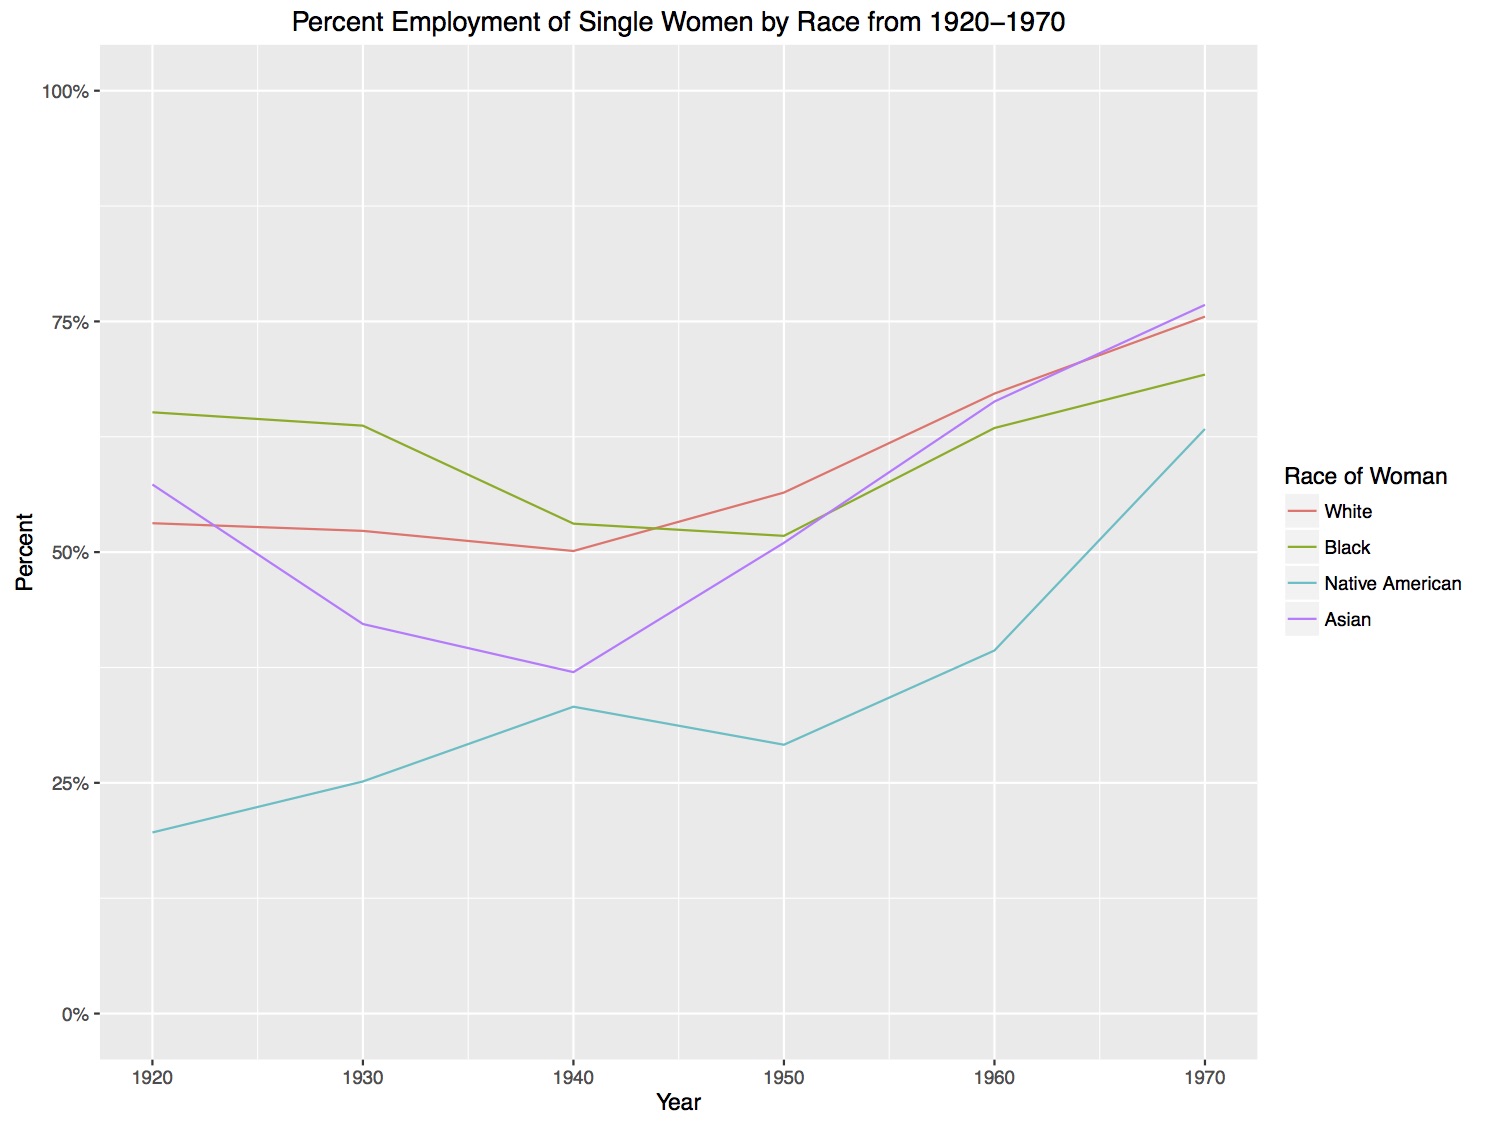
Figure 2A: Line Graph of Percent Employment of Single Women from 1920-1970
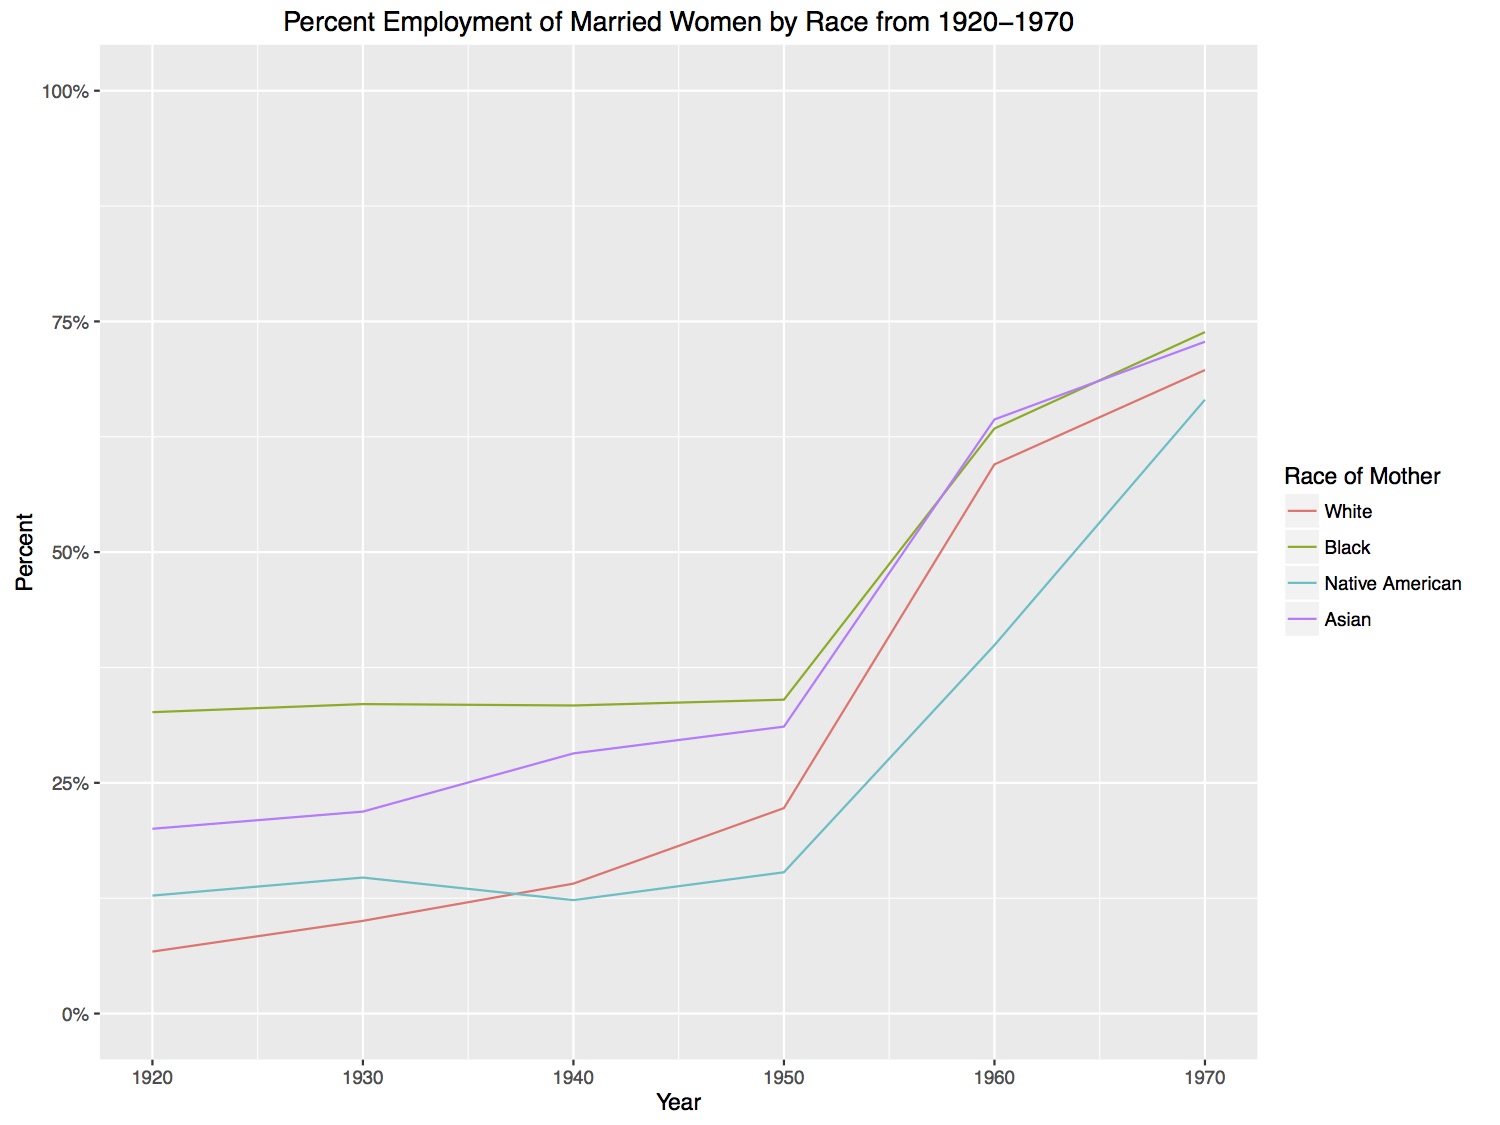
Figure 2B: Line Graph of Percent Employment of Married Women by Race from 1920-1970
Similar to Figure 1, in Figure 2 we see consistently lower percentages of employment among married women. Among both groups we see a boom in employment between 1950 and 1960. Although there is a slight down turn around 1930 for some groups it is not universal or a very large drop, except for single Asian women, for whom there is a large downturn. Interestingly, among both married and single women we see the lowest levels of unemployment among Native American women. Among single women white women are consistently less likely than black or Asian women to work. However, among married women, there was a larger gap between Black and White women that closed overtime.
The large downturn in Asian employment could be due to growing anti-Asian sentiment during the 1920s (Jacobson, 2001). During a time like the depression, when jobs were more scarce, those that employers saw as foreign may have been the first to go. Employers would not want to employ ‘foreigners’ when there were many white, native born, out of work. Otherwise, we see very little downturn in women’s employment, likely because women often worked in service industries and saw fewer cuts during this time than manufacturing (Lemons, 1967). In fact, during the depression it was not unusual for women to be the only ones providing income. This was another attitude shift towards women’s employment. During the depression few families were in any place to turn down employment, even if it meant the mother worked while the father stayed home. Necessity caused people to overlook their prejudices about women working. The very low rates of employment among Native American women is likely due to census classification (Folbre, 1989). Women living on the reservations would have more communal roles, and less formal employment. The differences in employment among white, Black, and Asian women are due to different needs and different social standards. Black and Asian women and men were often socioeconomically lower and more likely to require a second income, regardless of how socially acceptable it was for women to work. As female employment became more accepted, more white women entered the work force and that gap closed. This is an excellent example of women’s employment choices not truly being their own.
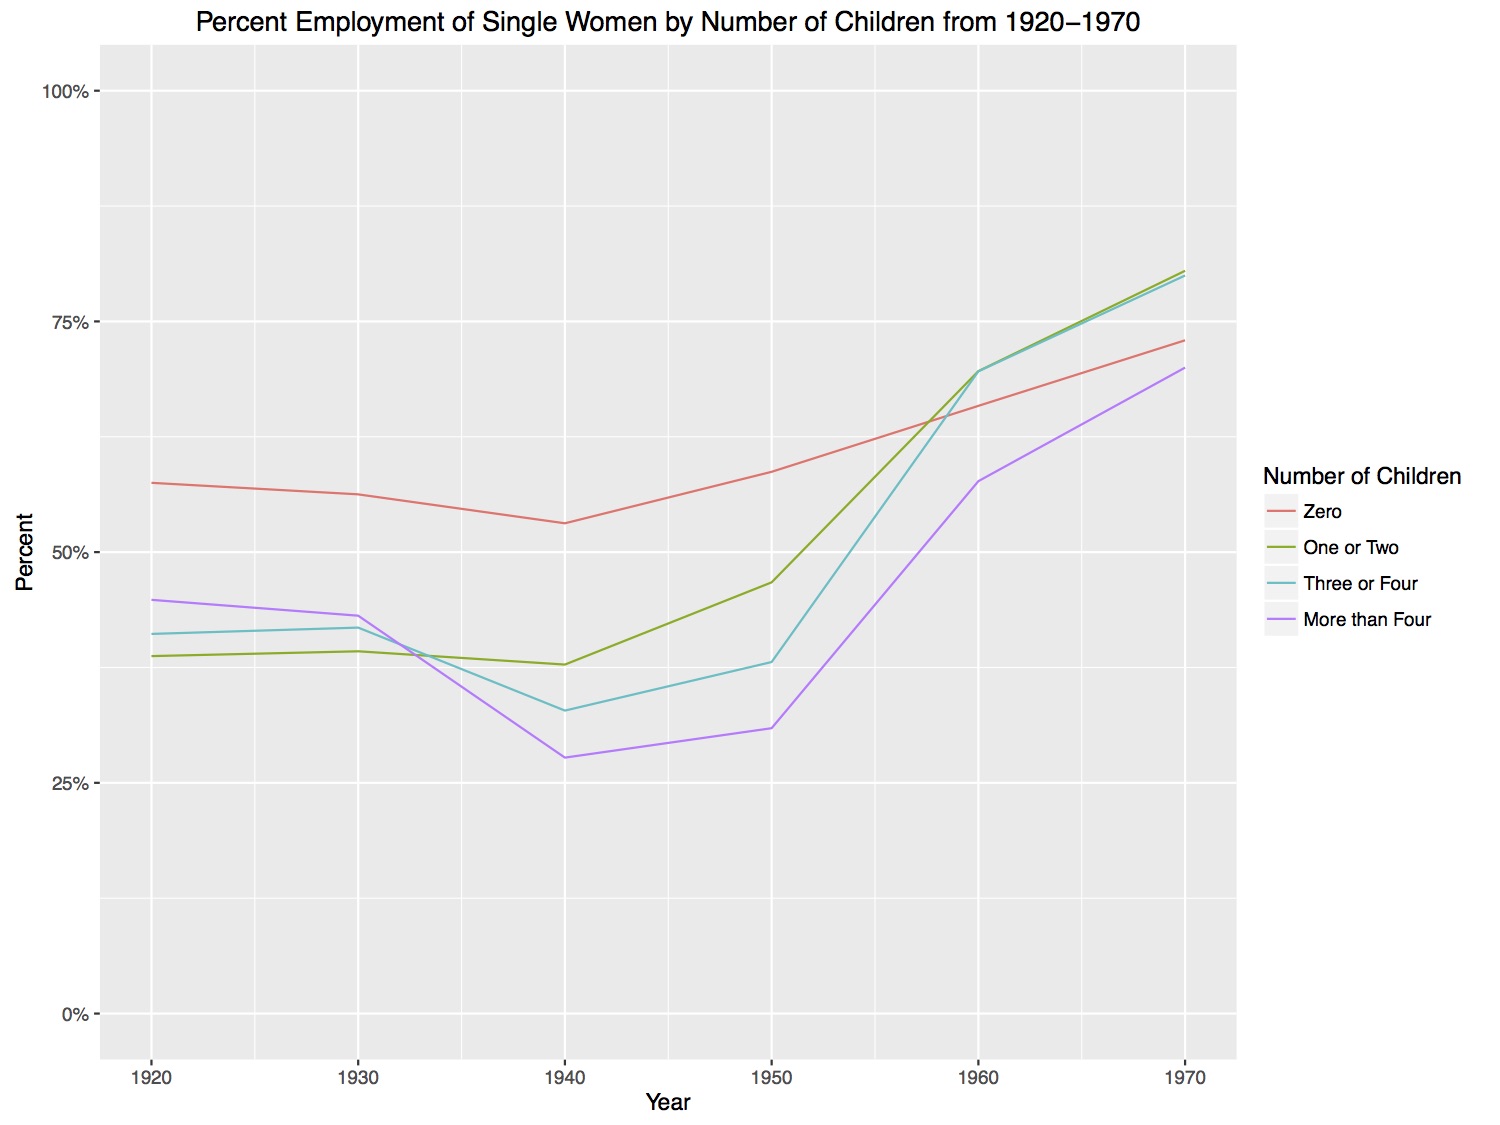
Figure 3A: Line Graph of Percent Employment among Single Women by Number of Children from 1920-1970
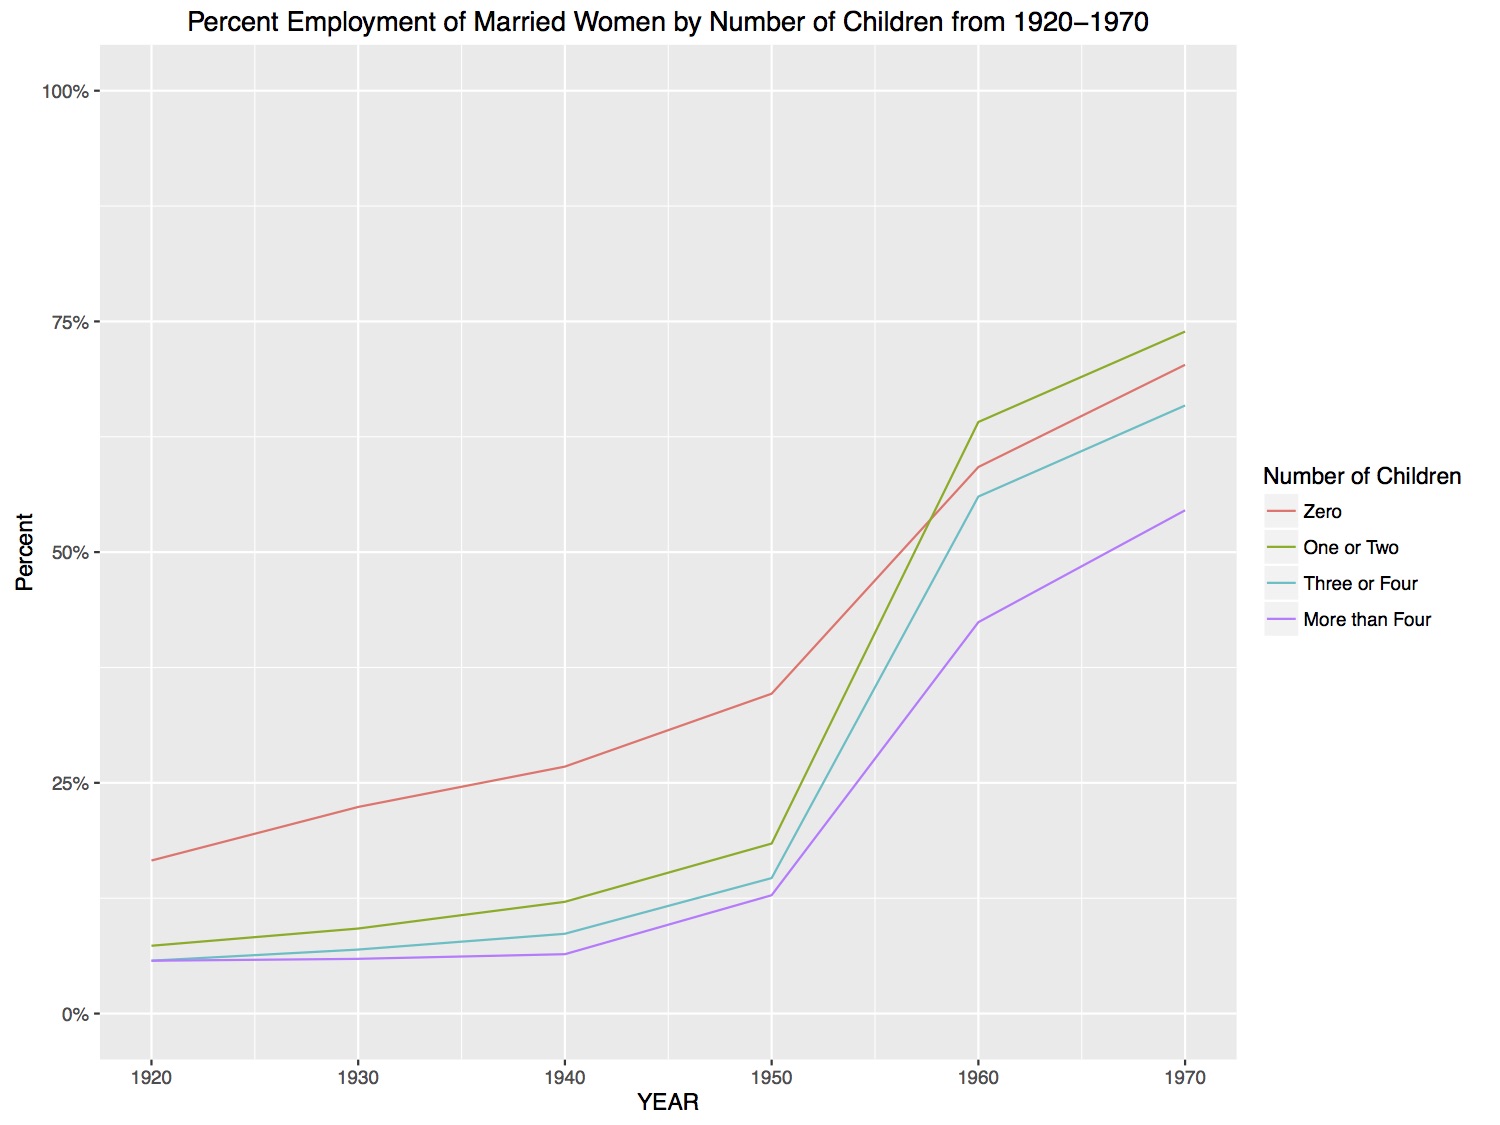
Figure 3B: Line Graph of Percent Employment among Married Women by Number of Children from 1920-1970
Yet again in Figure 3 we see an overall lower percentage of working married women compared to working single women. Among single women, percent working clearly decreases as number of children increases. For married women this trend is partially there, but not as clear. Among both groups in later decades, women with a few children eventually surpass women with no children’s employment. The lines for different numbers of children seem to run very parallel to each other, implying that the gap for number of children was very consistent and women with different numbers of children were all affected equally by external changes.
In the 1920s-1940s, when women’s agreed upon role was to care for the family we see the clear trend that women with more children worked less, as they had greater duties at home (Lemons, 1967). We also see low employment for women with no children due to the social taboo of female employment, however once a woman had children it was considered very damaging to her children for her to work (Lemons, 1967). Regardless of the financial strain of having so many children, women’s jobs were to care for them while fathers provided financially. However, especially following the employment boom of the 1950s, as opinions on women’s employment began to shift we see women with children’s employment approach those without. The idea that women could provide for their children not just as homemakers, but also as breadwinners created this shift (Feinstein, 1979). Families with multiple children needed the additional income more, but families with lots of children badly needed someone at home. Here we see the factors balance out putting mothers with 1-2 children at the highest employment rates. Single women without children already had a stigma. In these figures the category of single women contains never married women as well as widows and divorcees. The advantage of this categorization is that Single women contain all women without a partner currently providing for them; however it is likely that women once married may still have some income. Once married women would be free of the taboo of having children before marriage.
Conclusion:
Women’s history must be studied not just from the lens of historic events, but also from the view of family. Women, historically tasked with motherhood and house care are not as autonomous as men in their choices. More factors play into the everyday lives and choices of women. Few women worked or didn’t work solely out of personal choice; they were affected by social pressures, racial discrimination, cultural norms, basic financial needs, familial duties, and the choices of their husbands and fathers. Although the weight of these factors lessened with each decade, women’s history must be analyses along many dimensions.
In terms of race, the trends appear more similar than the literature suggested. Although white women did work less than black women, the difference is not large and they typically worked more than Native American or Asian women. It is very likely that this difference is because of census bias towards under reporting women employment, especially those who worked in the home. The relationships between number of children and employment are exceptionally clear. Increasing number of children decreases employment consistently, but towards 1970 the groups begin to converge.
This analysis helps add visible figures to more abstract concepts. It reveals points where census data seems to deviate from historical ideas, such as among different race’s employment, and allows us to analyze broad trends like family life with numeric trends like number of children.
This project could be expanded to include figures which analyzed other variables together to help pinpoint causes of changes when there were multiple. For example, if average number of children per year it could be a part of why average female employment increases, since those with more children are more likely to work more. In a project like this the many variables of race, employment, relationship status, and number of children all interact with each other on different levels. This makes it difficult to completely isolate trends. A regression could be done to help identify relationships. This has served as a more broad overview on these trends, however, it would be possible and interesting to document specifically within one race, as this would be an easy way to isolate the trends, by holding a very influential variable like race constant. Additionally, the variable of economic class could be added, to help quantify those working out of necessity instead of choice. The rich topic of women’s employment has been well documented, yet is still open to additional analysis.
Work Cited:
Chafe, William H. The American Woman: Her Changing Social, Economic, and Political
Roles, 1920-1970. New York: Oxford University Press, 1972. Print.
Feinstein, Karen W. Working Women and Families. Beverly Hills, Calif: Sage Publication,
1979. Print.
Folbre, Nancy, and Abel, Marjorie. “Women’s Work and Women’s Households: Gender
Bias in the U.S Census,” Social Research 56:3 (1989), pp. 545-569.
Jacobson, Matthew F. Barbarian Virtues: The United States Encounters Foreign Peoples at
Home And Abroad, 1876-1917. Hill and Wang, 2001.
Lemons, J S. The New Woman in the New Era: The Woman Movement from the Great
War to the Great Depression. Ann Arbor, Mich: Xerox University Microfilms, 1967.
Print.
Myrdal, Alva, and Viola Klein. Women’s Two Roles, Home and Work. London: Routledge & Paul, 1956. Print.
Standlee, Alecea “Shifting Spheres: Gender, Labor, and the Construction of National
Identity in U.S. Propaganda during the Second World War,” Minerva Journal of Women and War 4 (Spring 2010): 43-62.