

This post looks into the female immigrant population during the 20th century in America, specifically their presence in the labor force. I found in a previous post that the female immigrant population is not as affected by the Immigration Act of 1924 and becomes larger than the male immigrant population by 1960. Female participation in the labor force has increased over the course of the 20th century for multiple reasons, narrowing the gender gap in the labor force. In general, education levels, family income, and the presence and age of children have factored into female participation in the labor force (Cotter, 2001, 431). Furthermore, the rising wage rates from the 20th century causes men to bring more leisure into their lives from the increased income and became an incentive for women to work more (Cotter, 2001, 432). While there was an increase in the female labor force during this time, there was also a high level of scrutiny regarding immigration. A large portion of this scrutiny centered on Americans feeling threatened by immigrants taking their jobs (Jacobson, 2008, 69). This post looks into the participation of female immigrants in the labor force from 1900-1960 in order to relate the rise in female labor participation and the levels of female immigration during this time.
Data
I gathered data from the Integrated Public-Use Microdata Series (IPUMS) for this project. I used 1% data samples from the 1900-1960 censuses and took the BPL (Birthplace), SEX, PERWT, AGE and OCC1950 variables from these samples. The PERWT variable represents the sample weight of each individual. The SEX variable gives the gender of the individual. The BPL variable indicates the birthplace of the individual. I grouped the BPL variable into these categories: U.S. Born, Other NA, Central and South America, Northern EU, UK & Ireland, Western EU, Central/Eastern EU, East Asia, Other Asia, and Other. I grouped the OCC1950 variable into these separate categories created by IPUMS: Professional, Farmers/Farm Labor, Managers/Proprietors, Clerical, Sales, Crafts, Operatives/Laborers, Private Service, Public Service and non-occupational.
Methods
I created multiple graphs in order to research this topic. To narrow down the population to the working immigrant population I only included age cohorts of ten years starting at 20 years of age and ending at 70 years of age. I took out the non-occupational category of OCCUPATION in order to select only the working population of female immigrants as well. I also made separate data sets for each census year to better analyze the female immigrant labor force. I made multiple bar graphs that chart OCCUPATION on the x-axis and the number of people in each occupation on the y-axis. The BIRTHPLACE variable is used to fill the bars in the graph, and it is faceted by the five created age cohorts and each individual census year. The code for this project can be found here.
Results
Figure 1:
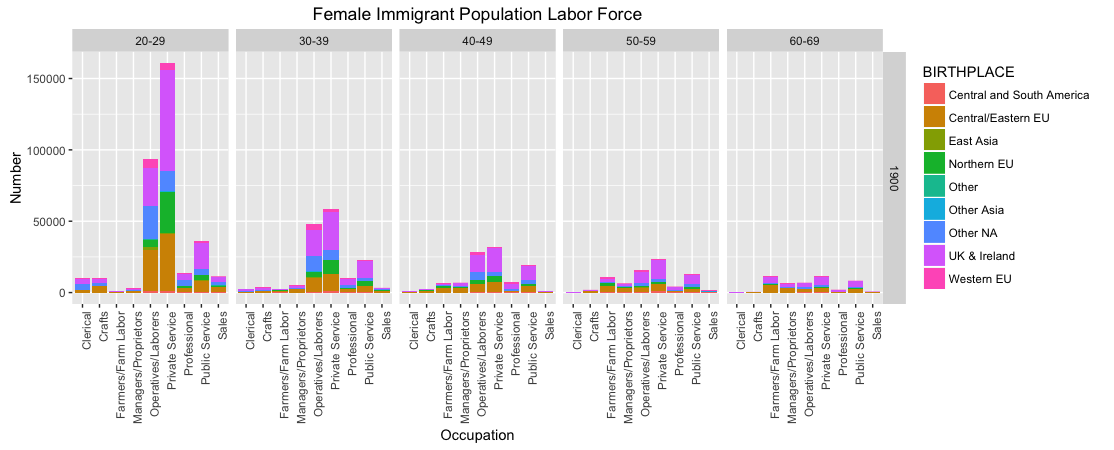
Figure 1 illustrates the female immigrant labor force in 1900. Most female immigrants work in either private service or the operatives/laborers categories with a more equal distribution over the other occupation groups. Initially, private service is almost double the next category of operatives/laborers in the 20-29 years old age cohort, but this difference becomes almost nothing in all the other age cohorts. Both the private service and operatives/laborers groups are significantly lower following the 20-29 age cohort, indicating both a lower participation from older immigrant women in the labor force. The largest immigrant groups in the labor force in this graph are the UK & Ireland, and Central/Eastern and Northern Europe.
Figure 2:
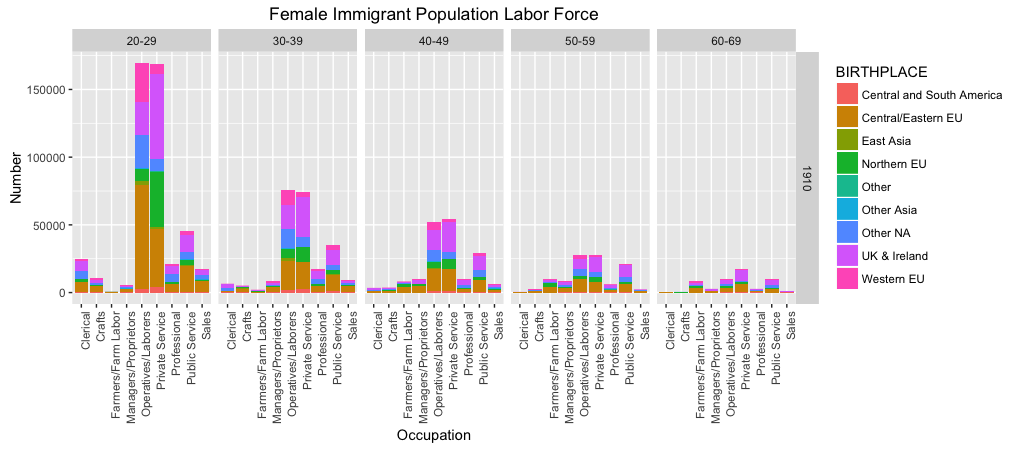
Figure 2 displays the female immigrant labor force in 1910. In this graph all occupational groups except for farmers/farm labor have increased, especially the operatives/laborers category in the 20-29 age cohort. The operatives/laborers group, contrary to figure 1, is slightly greater than the private service group. A large influx of European immigrants, especially from Central/Eastern Europe, boosted the operatives/laborers category and marginally increased the private service profession. Like figure 1, there is a steep decrease in the labor force from the older cohorts, but they also show significantly increased participation in all categories. This reflects the increased immigrant population as well as a higher participation of immigrants in the labor force.
Figure 3:
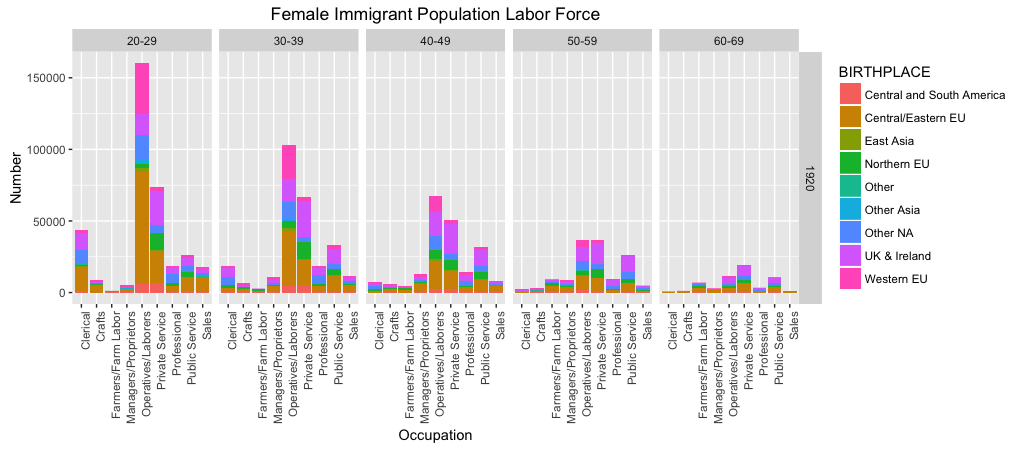
Figure 3 shows the female immigrant labor force in 1920. There is a large decrease in both the private and public service categories in the 1920 census in the 20-29 age cohort with the most significant increase appearing in the clerical profession. While the operatives/laborers category remains constant in the 20-29 age cohort, it has a large growth in the older age cohorts compared to the 1910 census. The immigrant groups that most affected this increase in the operatives/laborers category were the Central/Eastern and Western European groups. Overall, the total female immigrant population in the labor force increased from the 1910 census.
Figure 4:
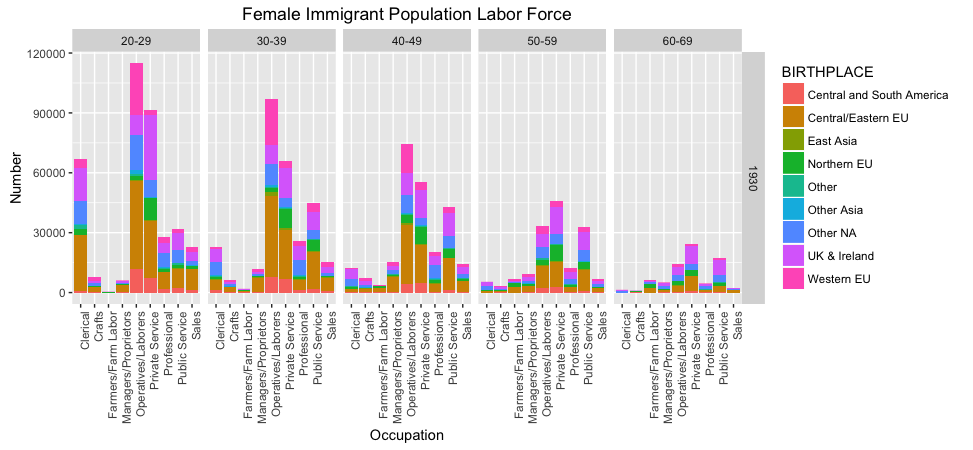
Figure 4 illustrates the female immigrant labor force in 1930. It is important to notice that the y-axis on this graph has a smaller scale than that of the first three figures. This smaller scale can be attributed to decreased number of women in the 20-29 age cohort in the operatives/laborers profession therefore lowering the highest number need on the y-axis. Even with this change, there is still an increase in both the private service and clerical categories. There is a steep drop in the clerical profession from the 20-29 age cohort to the 30-39 cohort. In this figure, there is clear downward linear progression in most of the profession categories of participation going from the youngest to oldest age cohorts. Like the previous figures, the most impactful immigrant groups on these categories are Central/Eastern and Western Europe.
Figure 5:
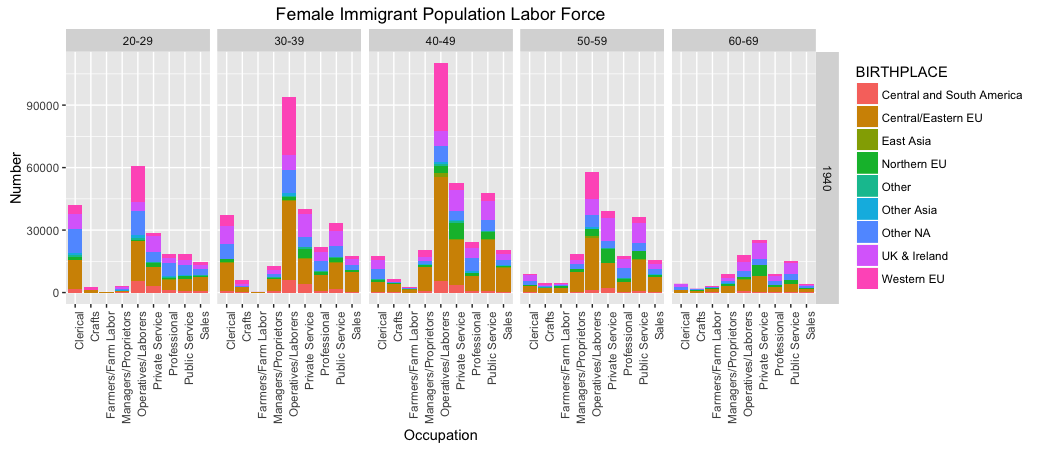
Figure 5 shows the female immigrant labor force in 1940. This graph illustrates a completely different image of the female immigrant labor force than the four preceding figures. Overall the number of female immigrants in the labor force has decreased from the 1930 census and the age cohort distribution has changed drastically as well. Here the 40-49 cohort reports the most workers, with operatives/laborers holding more than double any other profession. The 20-29 age cohort surprisingly has only the third most numbers, indicating either a lack of participation from the cohort or a decrease in the population of that cohort. The Central/Eastern and Western European immigrant groups still maintain a majority on the total female immigrant population in the labor force with this decrease in population.
Figure 6:

Figure 6 displays the female immigrant labor force in 1950. This graph continues to show that the working population of female immigrants in the U.S. ages and significantly decreases up to this point in the 20th century. The 40-49 and 50-59 age cohorts illustrate more or less the same population and spread of professions as they did when they were the 20-29 cohorts in 1930 and 1920. Those cohorts have mainly remained with the same profession for 20-30 years, with only the private service category declining. The clerical profession sees the most participation out of the younger age cohorts in this figure. Still, the Central/Eastern and Western European immigrant groups still dominate the 40-49 and 50-59 cohorts as well. The 20-29 and 30-39 age cohorts in this figure have a significantly lower population and also have much more equal representation from all of the immigrant groups.
Figure 7:
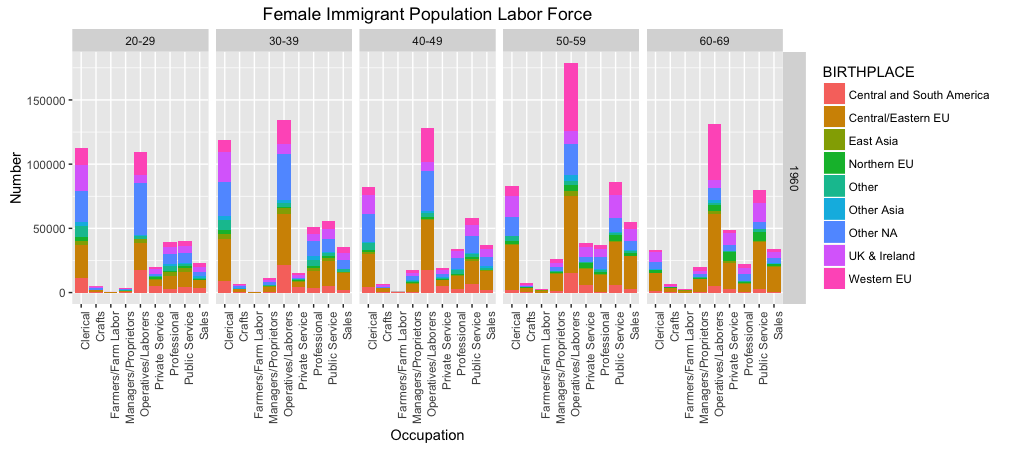
Figure 7 represents the female immigrant labor force in 1960. This graph depicts a large boom in the female immigrant labor force population. The largest cohort is the 50-59 age group, but the levels of participation in other age cohorts and professions are much greater than in 1950. The y-axis numbers returned to the same levels as the first three figures and there is also greater participation across all cohorts. The clerical and operatives/laborers categories dominate the younger age cohorts whereas the operatives/laborers group increases markedly in the 50-59 cohort. The public service profession also sees gradual increases each year compared to the clerical category which sharply declines after the 30-39 cohort and again after the 50-59 cohort. The distribution of immigrant groups remains the same for the older cohorts, dominated by Central/Eastern and Western Europeans, but the younger cohorts become more balanced and even show a larger percentage of immigrants from other parts of North America and Central America compared to European immigrants.
Conclusions
These graphs illustrate both changes in levels of immigration in the United States during the early to mid 20th century as well as professional biases that U.S. culture has towards female immigrants. The female immigrant population most gravitated or more likely was pushed towards the profession categories of operatives/laborers, private service, public service, and clerical work. These jobs, being a housemaid or secretary for example, are not as respected in American society but still essential to the economy. These categories represent many of the positions that perform the grunt work of society. Initially I am sure that the female immigrant population was pushed towards these jobs, but later on found comfort and unity in creating their own communities around these mostly service based industries based on the age cohorts that fell under the 20-29 groups in 1920 and 1930 having similar populations and distributions as they aged each decade. Furthermore, these graphs clearly lay out the effects of the Immigration Act of 1924 on emigration to the U.S. The drastic fall of the 20-29 age cohort of female immigrants in the labor force in 1940 and 1950 is a direct result of the restrictions placed on immigration by the Act. By 1960, the flow of immigrants coming into the U.S. seems to have normalized to somewhere between the high of the early 20th century and the immediate decade after the Immigration Act of 1924. With regards to the female labor force, the restrictions placed on certain countries, mainly in Europe, seem to have allowed larger populations from other countries like Canada and Mexico to become more of a presence in America and its labor force.
Works Cited
Cotter, David A., Joan M. Hermsen, and Reeve Vanneman. “Women’s Work and Working Women: The Demand for Female Labor”. Gender and Society 15.3 (2001): 429–452. Web..
Jacobson, Matthew Frye. Barbarian Virtues: The United States Encounters Foreign Peoples at Home and Abroad, 1876-1917. New York: Hill and Wang, 2000. Print.