This investigation primarily focuses on changes in the population of immigrants from the Slavic countries, over the first half of the twentieth century. In order to do so in an interpretable way, I make use of population pyramids and relative frequency kernel plots, identifying differences in age distributions for various cohorts. I pay particular attention to the net effect that each world war had on Slavic immigration and the Slavic-American population, seeking to determine whether the incentives to immigrate or restrictions against those wishing to do so had a greater impact during each period.
Background
Immigration has long benefited the American public. As a result of this country’s acceptance of the world’s “tired, […] poor, […] huddled masses yearning to breathe free” (Lazarus, The New Colossus), America was able to readily capitalize on the technological breakthroughs of the Industrial Revolution. Unfortunately the dearth of census data from this era forces me to look at other time periods if I choose to investigate immigration. Moreover, while the Industrial Revolution increased demand for immigrants, mass migrations are often the result of supply-side factors, such as war or famine. The first half of the twentieth century provides me with the opportunity to consider one migration wave caused by both categories of factors.
The Second Industrial Revolution took place between 1870 and the beginning of the first World War. Before the outbreak of the war, able-bodied men and women from poorer parts of Europe eagerly set sail to America, chasing the promise of secure careers in factory jobs (Jacobson 2000, 63). Jacobson describes the significant differences in the wages that American workers and their counterparts in Europe could expect to receive (ibid.).
The onset of the first World War invariably led to its own set of challenges but its conclusion prompted a flood of migrants fleeing their destroyed homes. In areas where this damage was significant (such as the Slavic countries), communities would emigrate by the village. The demand for foreign workers of specific ethnicities continued into through the mid-20th century. Employers associated proficiency in certain trades with certain countries, and often hired workers of different backgrounds in order to prevent unionization (Jacobson 2000, 69).
The effect of the 1930’s and 1940’s is more difficult to predict. On one hand, the conclusion of the second World War in 1945 should have led to increase immigration. Conversely, increase scrutiny towards immigrants during the 1940’s, culminating in the passage of the 1952 Immigration and Nationality Act (McCarran-Walter Act), prevented many of those who could have entered in prior decades from starting a life in America. This act set quotas on immigrants of specific backgrounds and allowed for the deportation of suspected communists. Moreover, reverse migration has been observed during the Great Depression years for Mexican migrants and Americans from the South (Gregory 2005, 32). It is plausible that similar effects led to repatriation among Slavic immigrants.
Data and methodology
I turned to the Integrated Public-Use Microdata Series, using census samples from 1900 through 1950. For all years, I used the 1% sample provided by IPUMS. The variables of interest for this investigation include an individual’s age, birthplace, birthplace of their parents, and years since immigration (collected for immigrants). Region and citizenship status were also considered but did not leave me with any results worth noting.
In order to identify the relevant populations, two indicator variables were created. One variable indicates if an individual is a first generation Slavic immigrant. For my purposes, the Slavic countries include all countries commonly classified as belonging to the Central or Easter European subcontinents, with the exception of Austria and Germany. In order for an individual to be classified as a Slavic immigrant for my purposes, both of their parents must also be born in a Slavic country. This restriction aims to exclude the children of expatriates who happened to be born in the region.
The second indicator variable simply checks if an individual was born in US territory and has at least one parent born in a Slavic country. As such, it classifies individuals as second generation Slavic immigrants on the basis of conventionally accepted definitions. Please note that it is not possible to verify that the ‘pre-immigrant’ generation (in this case, grandparents) was born in a Slavic country, which I do for first generation immigrants.
For first generation immigrants (in the 1900 to 1930 censuses), I can estimate the amount of time they have spent in America by considering the difference between the census year and the year of immigration variable. I can also consider the age at immigration by subtracting this difference from an individual’s age.
With these variables in place, I are able to stratify on the basis of either classification, as well as their combinations. By stratifying the age distribution of various groups of immigrants on the census year, I can see how the makeup of the Slavic immigrant population has changed over time. The results of this methodology were plotted in the form of relative frequency kernel plots and population pyramids, to be discussed below in further detail.
Results
Beginning with unrestricted data on first generation immigrants, I plot each age distribution in order to observe aggregate trends, as shown in Figure 1. The mean age of Slavic immigrants has increased by ~8 years between each census from 1910 to 1950. Assuming that immigrants generally arrive at as young, working age adults, this figure seems to imply that not very much immigration is occurring between these years; one would expect a mean increase of ~10 years per census if no immigration was occurring. The notable exception to this is the change from 1900 to 1910, where there is actually a decline in the mean age, implying significant immigration.
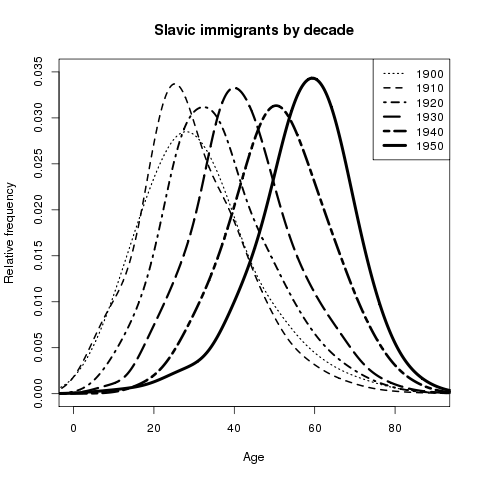
Figure 1.
Unfortunately, this chart does not show me the distribution of immigrants that actually immigrated between census years (rather illustrates the distributions of living immigrants arriving before a given year). Fortunately, the variable I constructed that estimates the amount of time spent in America (see Data and methodology) allows me to filter the data for each census to only immigrants that had arrived within the previous decade. Doing so for the 1890’s and 1900’s (using the 1900 and 1910 censuses, respectively), I find that the age makeup of immigrants in the two periods was fairly constant. As shown in figure 2, much more Slavic immigration occurred in the 1900’s than the 1890’s. As a result of immigration by young men in the 1900’s, the mean age of those immigrating in the decade decreased by ~2 years (see spread between horizontal lines, Figure 2).

Figure 2.
In contrast, I may choose to look at the change in the age of Slavic immigrants arriving in the 1920’s, comparing this to those who had arrived in the 1900’s (Figure 3). As suspected, the mean age of immigrants shot up by ~12 years (see horizontal lines). However, my suspicion that this was due to decreased immigration was not correct; Slavic immigration has dramatically increased. Instead, I find that the men and women moving to America during these decades were significantly older, implying the migration of full families rather than young single laborers searching for better work.
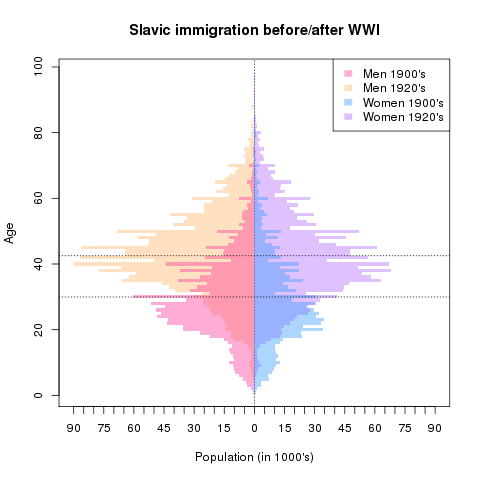
Figure 3.
Unfortunately the removal of the year of immigration question in the 1940 census means I cannot directly compare the 1920’s boom to the subsequent shock resulting from the Great Depression and WWII. Instead of observing immigrants arriving within a decade, I consider changes in the immigrant population between years, at each age. Figure 4 illustrates precisely this. In contrast to my previous comparison, the ~18 year increase in mean age indeed appears to be due in part to reduced immigration. Note that the population of older individuals increases by far less than the population loss of young immigrants. Barring a significantly increase in mortality rate, this is consistent with the immigration restrictions and repatriation discussed in the aforementioned research. The 1924 National Origin Act is one restriction that may be most responsible for what we see in Figure 4.
This act, aiming to preserve American racial homogeny, limited the number of people that could immigrate from a given country to 2% of the number of people from that country already in America by 1890. By doing so, President Coolidge and backers of the bill hoped to stem the flow of Southern and Eastern Europeans, among other groups.
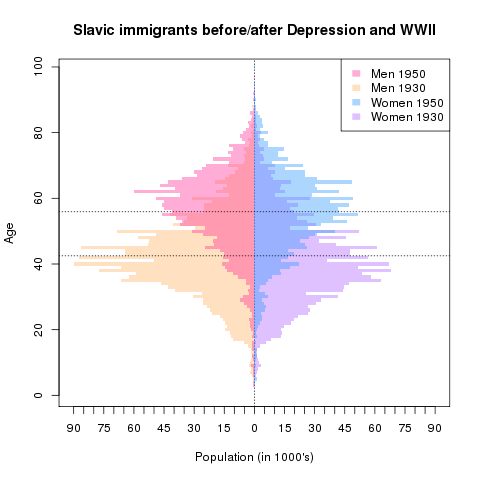
Figure 4.
Figure 5 is analogous to Figure 1, except that it considers second generation immigrants by year. Note the flattening of relative frequency curves. Given that older first generation immigrants are likely to have children with a broader range of ages, the flattening of the curves and increase in mean age is expected on the basis of biology and mathematics.
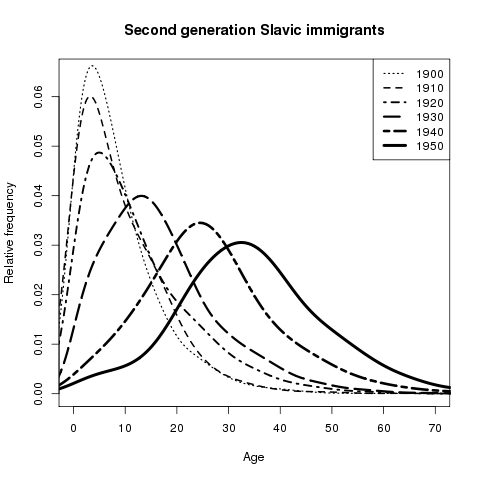
Figure 5.
However, all relative frequency kernel diagrams fail to show me how a total population has changed from year to year. In order to investigate this metric for a span of time (1930-1950) and I create a synthetic cohort of individuals that would be between the ages of 0 and 19 in 1930. By shifting the range of ages included by 10 years for every census, I are able to track the same age cohort across time. I choose to employ a truncated population pyramid in oder to display this population information, as shown in Figure 6.
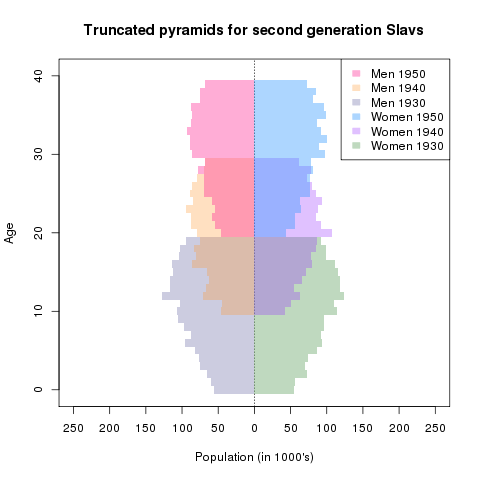
Figure 6.
Figure 6 supports the conclusions I drew from Figure 4, as is evident in the shrinking of successive pyramids. The ostensible disappearance of first generation immigrants between 1930 and 1950 is likely the result of emigration on a family level, which is why their (probable) children are leaving with them. Alternatively this disappearance may have occurred due to war casualties, or it may have only occurred “on paper” if racist attitudes and McCarthyism simply led to fewer individuals admitting to foreign links on the census (Roediger 2005, 134).
Unfortunately I cannot differentiate between these “paper losses” and genuine emigration, but I can investigate whether or not the change is due to the war by comparing second generation immigrants to native born Americans of the same age cohorts.
In Figure 7, I do just that. By matching the 0-19 years-of-age cohorts in 1930 to the 20-39 years-of-age cohorts in 1950, I can estimate the proportion of individuals accounted for in both census that were less than 20 years old in 1930. If I stratify this analysis across by second generation Slavic status, I find that for non-Slavs, virtually all people can be accounted for. In contrast, only ~80% of second generation Slavs are captured in the second census. If this ~20% loss was the result of war or death, I would expect similar amounts of native-born Americans to go missing. Consequently, there must be some heterogenous effect, be it reverse migration (as theorized) or an unwillingness to recognize one’s ancestry.

One should note that the questionnaire text did not change radically between these years. In 1930, the census asked:
Place of birth of each person enumerated and of his or her parents. If born in the United States, give the State or Territory. If of foreign birth, give country in which birthplace is now situated. Distinguish Canada-French from Canada-English, and Irish Free State from Northern Ireland.
In 1950, it asked:
25. What country were his father and mother born in? (Enter US or name of Territory, possession, or foreign country)
Clearly, the difference is not due to a change in the nature of what is being asked. Further data on emigration would be incredibly valuable in explaining this fairly dramatic result.
Conclusion
In short, the fifty year story of Slavic immigration and identity in the early 20th century is one with many chapters. Towards the tail end of the Second Industrial Revolution, age distributions behave in precisely the way I expect them, given the literature explored. The conclusion of the first World War prompts massive waves of migration of families searching for a better life. This scenario does not repeat itself at the conclusion of the second World War, likely as a result of the counter-effect of the Great Depression and restrictive immigration policy. It is plausible that McCarthyism and racist attitudes may also have led to the dramatic disappearance of Slavic immigrants after the war.
Sources
Source code for analysis and figures
Gregory, James N. The Southern Diaspora: How the Great Migrations of Black and White Southerners Transformed America. Chapel Hill: University of North Carolina Press. 2005. Print.
Jacobson, Matthew Frye. Barbarian Virtues: The United States Encounters Foreign Peoples at Home and Abroad, 1876-1917. New York: Hill and Wang, 2000. Print.
Roediger, David R. Working toward Whiteness: How America’s Immigrants Became White: The Strange Journey from Ellis Island to the Suburbs. New York: Basic, 2005. Print.
Ruggles, Steven, Katie Genadek, Ronald Goeken, Josiah Grover, and Matthew Sobek.Integrated Public Use Microdata Series: Version 6.0 [Machine-readable database].Minneapolis: University of Minnesota, 2015.

