

The US Census has long been a governmental tool for understanding how to structure legislation to best serve the population. However, racial categorization in the census is largely responsible for creating the racial divisions that we experience today and the societal perception that race is somehow a legitimate way to differentiate groups of people. Historically, the government and society have used race categorization and science as tools for justifying racism. Kenneth Prewitt, in his book What is Your Race?: The Census and our Flawed Efforts to Classify Americans, postulates the census’ role in creating inherently-racist legislation when discussing the role the 1790 census played in forming the “infamous three-fifths constitutional clause”, stating that “The three-fifths clause was the new nation’s initial step in connecting race, policy, and science into one interdependent bundle.”(31) Furthermore, Prewitt states that the early census was viewed as a tool for policing the population to ensure that “its size and composition match policy objectives”, which today could be argued as neo-fascist.(32)
One might say that it would be a disservice to society to examine the past, racist political intent of the US Census without discussing the contemporary effects of the Census and the race-based legislation it influenced. Regional demographic differences often provide a good example of how historic, structural racism, like that present in past censuses, has lead to racial division today. Some believe that, in the past forty years, a demographic phenomenon has emerged in Chicago. Social scientists and statisticians are beginning to see a dwindling of the young, black male population in the Chicago metro area. In this post, I will examine how this phenomenon is presented in US Census data, as well as how the Census Bureau and Census itself may have lead to the present situation.
Although the Census Bureau has been consistent with the single “Black/African American” racial category only since the 1930 Census, this presents us with plenty iterations of the Census to see if there has been a demographic change over the last forty years. In order to look for significance in any demographic change within the category of black men in the Chicago metropolitan area, it will be useful to compare that group’s demographics with the demographics of all men in the US, as well as all black men in the US across the same years. Hopefully, this will provide a visual representation of the demographic phenomenon in Chicago.
Data:
The Census data I used was gathered from the Integrated Public-Use Microdata Series (IPUMS). My dataset includes sample data from the 1930 Census through the 2000 Census. The IPUMS variables that I collected data on are AGE, YEAR, SEX, RACE, RACED, PERWT, METAREA. The AGE, YEAR, SEX, RACE, and RACED variables are taken by IPUMS directly from the Census. METAREA, however, is a variable designed by IPUMS to group metropolitan areas, described by IPUMS as “a region consisting of a large urban core together with surrounding communities that have a high degree of economic and social integration with the urban core”, in order to include people that may not have been included in the original CITY category. Since 1950, the Office of Management and Budget, has produced and continually updated standard delineations for metropolitan areas. However, it is important to note that the 1930 and 1940 Censuses retroactively adopted the 1950 delineations for metropolitan areas. The PERWT variable is a weight assigned to each individual in the sample.
Method:
First, I organized my data through the following steps. I selected my data for men, choosing only to look at one value for the SEX variable, as I am only interested in looking at the demographics of the male population. Next, by creating a variable AGECAT I separated my data into appropriate age categories. Each category is initially labeled by number 1-9, and will represent a group of people ranging by ten years in sequential order. This will allow me to more easily look at population age density. Next I created labels for my AGECAT variable, more clearly showing the ages that each category represents.
Once I have organized my data, I separated the data into the different racial and regional groups that I wish to compare demographically. I created a variable that included the data for all men in the US, allowing me to plot the population density for the corresponding group. Next, I created variables for black men in the US, black men in Chicago, and all men in Chicago. This allowed me to plot the comparable population densities for each of the aforementioned groups. My R code can be found here.
Results:
Figure 1:
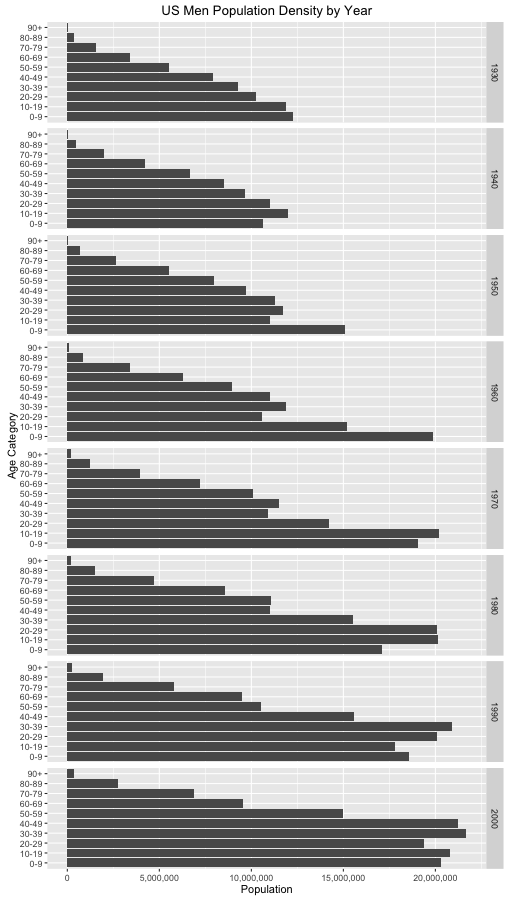
Figure one shows the age demographic for all males in the US across the decades examined. Here, one can see such historic demographic trends as the drop in fertility after the Great Depression in 1929, as well as the baby boom throughout the 1940s, 50s, and 60s. This demographic will serve as the first control group with which the subsequent figures will be compared, as somewhat of a control group.
Figure 2:
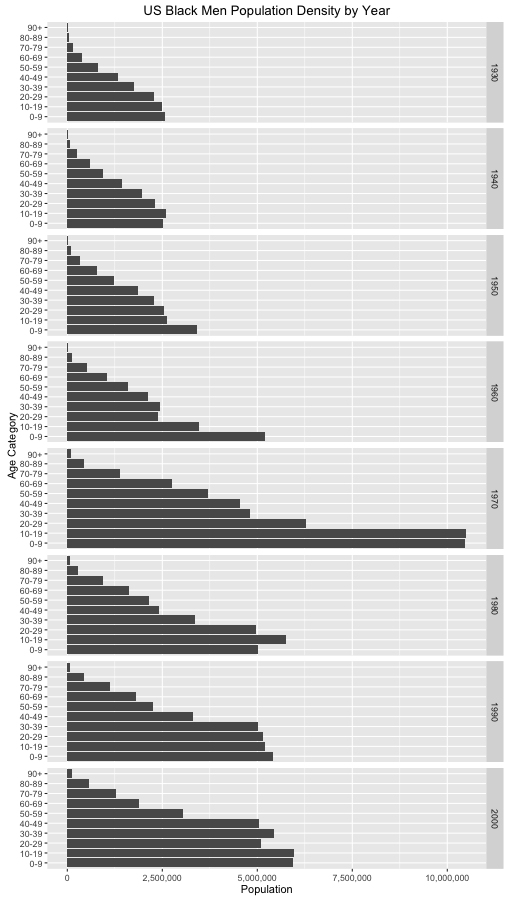
Figure two shows the age demographic for Black males in the United States across the decades examined. Other than the inexplicable rise of Black males ages 0-19 in 1970 and the subsequent decline or correction in 1980, similar trends are visible in the data. The baby boom is visible throughout the 1940s, 50s, and 60s, and a leveling of birth rates thereafter can be seen. This chart shows us that, in the scope of the United States as a whole, there is little differentiation between the age demographics in males between Black and White races throughout the decades examined.
Figure 3:
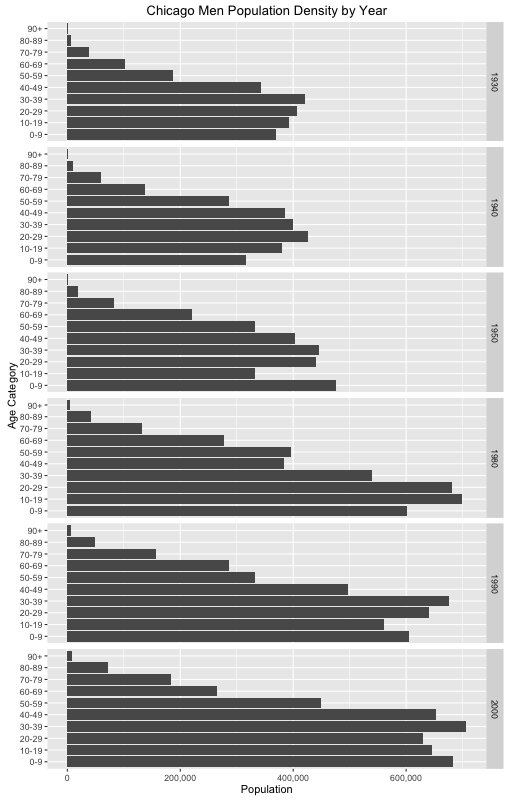
Figure 3 shows the population age structure for all males in Chicago over the Decades examined. It is important to note that the data are missing for 1960 and 1970, which make it difficult to draw a complete comparison between this chart and the previous two figures. However, there do not seem to be any major differences in trends between the decades examined here and that for all males in the United States.
Figure 4:
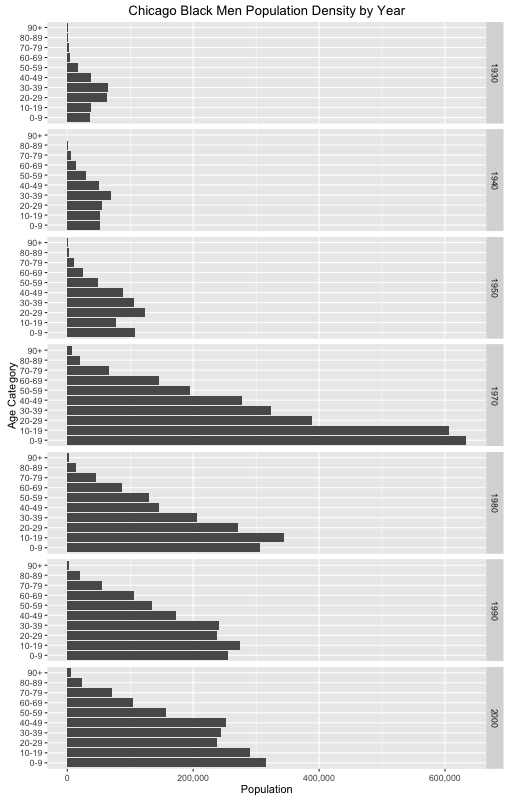
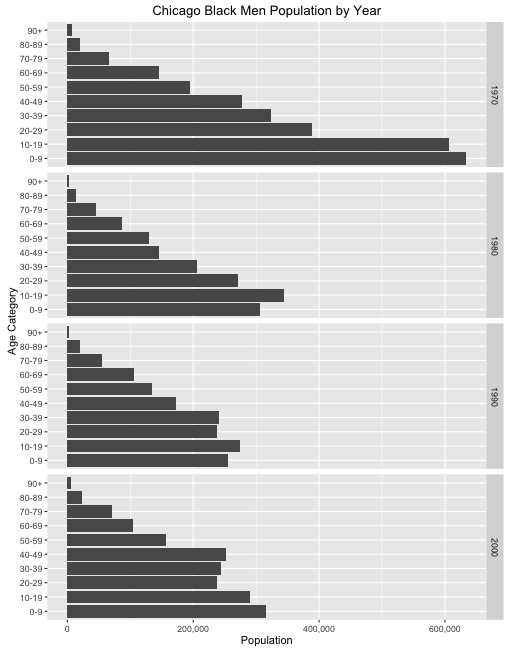
Figure 4 shows the age demographics for Black males in Chicago across the decades examined. It is important to note that the data are missing for 1960, so, again, it is difficult to draw a complete comparison between this chart and the previous figures. The baby boom is visible here in the 1950 census data, showing a steep increase in the number of males born in the 1940s. Furthermore, we see the same inexplicable spike, and subsequent decline in the population between 1970 and 1980. However, the trend I would like to focus on that differentiates this chart from the previous ones is the gradual decrease in the population of males in Chicago age 20-29 between 1980 and 2000. This trend is seemingly unique to Chicago and is not represented in the previous figures.
Figure 5:
 1
1
In Figure 5, I focused the chart on the decades during which the declining trend in Chicago’s young, Black male population is most prevalent. Although there is a general, inexplicable decline in the data for the Black male population between 1970 and 1980, we see an evening out of the census-to-census population thereafter in most age categories. However, there is a consistent, census-to-census decline in the population for the 20-29 age category between 1980 and 2000, despite the aforementioned correction in the other categories. This tells us that between 1980 and 1990, as well as 1990 and 2000, fewer males are making the jump from the 10-19 age category and into the 20-29 age category. Chicago’s Black males are “disappearing” between these two categories, a trend that differentiates Chicago metro area demographics from the demographics of the United States as a whole.
Conclusion:
Finding and exemplifying this trend in Chicago’s demographics with the help of US census data does not, however, help us to answer the questions of why this is happening as well as what we can do to change it. Further analysis of census data could be undertaken with the purpose of finding correlation between other unique factors and changes in Chicago during the same time period with hopes of reaching a partial answer for why this is happening. It is most important to remember, however, that statistical analysis is again only for analysis. It may be appropriate for the US government to revisit the purpose of the Census and what it is doing with the data that it yields. Although the contemporary Census claims to not be used for the neo-fascist purposes that it was originally founded and intended, it may be a good idea for the Government to examine how the Census can be utilized to help structure policy for the purpose of eliminating the shown disparities; How can policy be reformed to solve the problem of the mass-disappearance of young Black males in Chicago?
Sources:
Hochschild, Jennifer L., and Brenna Marea Powell. “Racial Reorganization and the United States Census 1850–1930: Mulattoes, Half-Breeds, Mixed Parentage, Hindoos, and the Mexican Race.” Stud. in Am. Pol. Dev. Studies in American Political Development 22.01 (2008): 59-96. Print.
Prewitt, Kenneth. What Is Your Race?: The Census and Our Flawed Efforts to Classify Americans. Princeton, NJ: Princeton UP, 2013. Print.