

Race has always been a highly controversial topic throughout U.S. history. Race can be defined as a simple characteristic of a person, but it has far greater implications and labels in reality. Race has become a process of classification that holds significance on social, cultural, and authoritative levels (Omi and Winant, 2014, 105). Starting in 1850, the U.S. Census included the “mulatto” race category as an attempt to study how the mixing of two races affected a person (Hochschild and Powell, 2008, 68). This was the beginning of an obsession with racial mixtures from racial scientists that had ended by 1930 (Hochschild and Powell, 2008, 71). This obsession ended and what followed was a specific racial hierarchy (Hochschild and Powell, 2008, 71). This post focuses on the white and black race categories in this post with regards to population distribution over this time. The black population in America was heavily restrained up until the 1870 census due to slavery, but after the emancipation proclamation they had the freedom to move. After the civil war, the U.S. population now had set social definitions of what it meant to be black or white (Hochshild and Powell, 2008, 71). I look at how these definitions affected the change in black and white population levels in four different regions of the country in this post.
Data
I gathered data from the Integrated Public-Use Microdata Series (IPUMS) for this project. I included 1% samples from the years 1850-1960. I used the SEX, RACE, REGION and PERWT variables from these samples for my research. The PERWT variable represents the sample weight of each individual. The SEX and RACE variables denote the gender and racial profile of that person. I separate the RACE variable into white, black, and other. The white category includes the white population of the United States which incorporates most European immigrants as well as Mexican immigrants until the early 20th century. The black category encompasses all persons that reports themselves as black as well as those who were classified as mulatto (In the census from 1850-1930), quadroon or octaroon (In the census from 1890-1930). The other category of race represents people who do not fall into the white or black race groups. The REGION variable indicates the region where each individual is currently living during the year of that census. I separate the REGION variable into these four categories: Northeast, South, Midwest, and West.
Methods
I graphed the free population of America by race, sex and region in order to see how the distribution of the black population changed by region following the emancipation of slavery. I also graphed the different race populations as percents of the total population in each region to see how the percents of the population changed over time. I created two graphs that give each gender and region its own image. I used the race categories I created to fill in the bars on each figure. The blue portion of each bar represents the white population, the red represents the black population, and the green illustrates the other race category. The Code for my project can be found here.
Results
Figure 1:
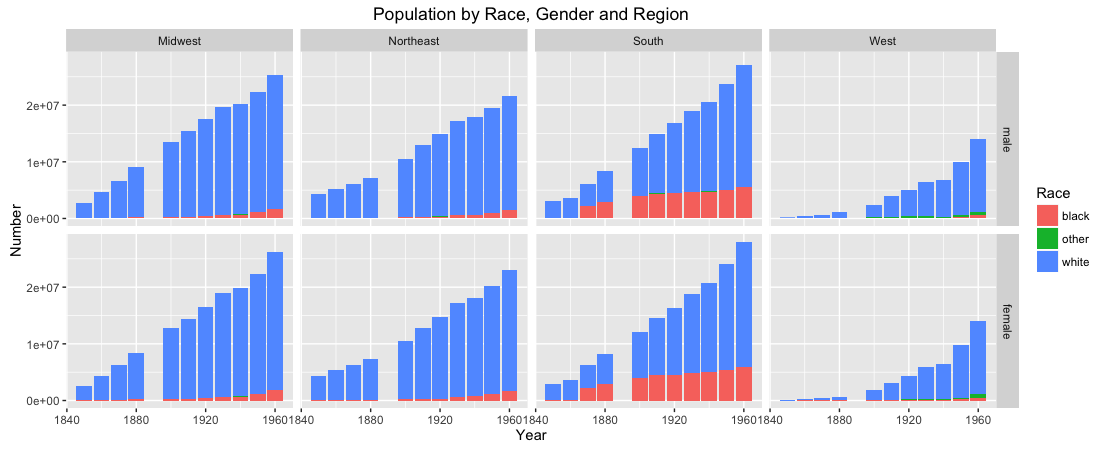
Figure 1 illustrates the total population of each region by sex and race from the 1850-1960 census. There is a steep jump in the black population in the south between the 1860 and 1870 census following the civil war due to the census counting the newly freed black population. There is also steady rise in the population of each race category in each region and by both genders over this time period. In the West we can see an exponential rise in the total population over this period. This rise in population in the west is due to the increase in the ‘white’ population in the region. After the emancipation of slavery, both male and female black persons became a significant portion of the Southern population. While the total population of the Southern region increases greatly over this time period, the black population barely increases with it. The white population increase in the South overshadows the black and other population increases. The Northeast does not start off with a significant increase in its black population after the civil war like the South but steadily over this time period. This difference between the Northeast and South is due to the significantly lower number of slaves in the Northeast that would have augmented the population upon being freed. The overall rise in Northeast population is similar to the rise in the Northeast black population. The same story plays out in the Midwest. There is a steeper population increase in the Midwest than in the Northeast, but there is also a steady increase in the black population like in the Northeast. There is no difference between population patterns of male and females.
Figure 2:
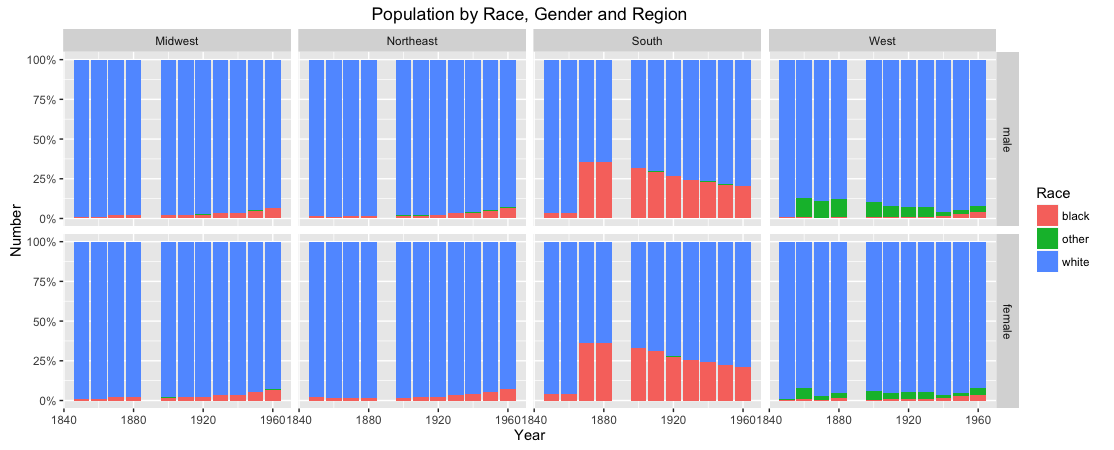
Figure 2 illustrates the same data as figure 1, but it displays each race category as a percent of the total population of each region. This graph reveals more about how the black population migrates from region to region. In the West, like in figure 1, the black population does not constitute a significant portion of the population during the this time period. The population of the South after the civil war changes from almost completely white to about 60% white and 40% black in the 1870 census. As time goes on, the percentage of the black population in the South decreases until it is cut in half to around 20% of the total Southern population by 1960. There is not much change in the Northeast and Midwest immediately after the civil war, only a few percent increase of the black population as a part of the whole. The black percentage of the total population increases steadily up to about 5% in 1960.
Conclusions
These results illustrate the inability for the black population to migrate from the South to other regions of the country. I assumed that the black population would want to leave the South after the civil war due to the extreme racism practiced in the South. The black population became a smaller percent of the total population in the South over this period not because they left in large numbers, but because the white population grew far more quickly than the black population in that region. In fact, figure 1 shows that the black population grew each year in the South. There is evidence for some migration to other regions, but the change in percent of the black population as a portion of the total population in the other regions is very small. This illustrates that either the black population did not want to move out of the South following the emancipation of slavery, that the South successfully kept the black population in the same region as an act of dominance, or a combination of both.
Works Cited
Tera W. Hunter (1993) Domination and resistance: The politics of wage household labor in New South Atlanta, Labor History, 34:2-3, 205-220.
Hochschild, Jennifer L., and Brenna Marea Powell. “Racial Reorganization and the United States Census 1850–1930: Mulattoes, Half-Breeds, Mixed Parentage, Hindoos, and the Mexican Race.” Stud. in Am. Pol. Dev. Studies in American Political Development 22.01 (2008): 59-96. Print.